


Hello, and welcome to this week’s edition of Points & Figures, put together by Kulsum & Mridula.
The idea is simple: to tell stories about the Indian economy, financial markets and investing through data. Instead of throwing random charts at you, we dig into overlooked datasets to explain shifts and trends you may otherwise miss.
This edition draws on research by AMFI and CRISIL Intelligence on India’s mutual fund industry. Their work looks beyond the headline growth in assets to show how the investor base is changing, why SIPs have become so important, where the money is being invested, and how far the mutual fund boom has spread beyond its traditional base.
Something fairly unusual has happened to mutual funds in India. They have gone from being one among many financial products to becoming part of the monthly routine for millions of investors.
Several things came together to make this possible. Digital onboarding made it easier to open and operate an account, the industry spent years advertising mutual funds and SIPs, and the strong equity market after the pandemic gave people a powerful reason to pay attention. SIPs then made the process almost automatic: instead of repeatedly deciding when to invest, people could set a fixed amount to leave their bank account every month.
The result is an industry that looks very different from five years ago. But the headline growth hides several stories underneath it.
The rich mutual fund machine
India’s mutual funds managed ₹31.43 lakh crore in March 2021. By March 2026, that had grown to ₹73.73 lakh crore, an annual growth rate of 18.6%.
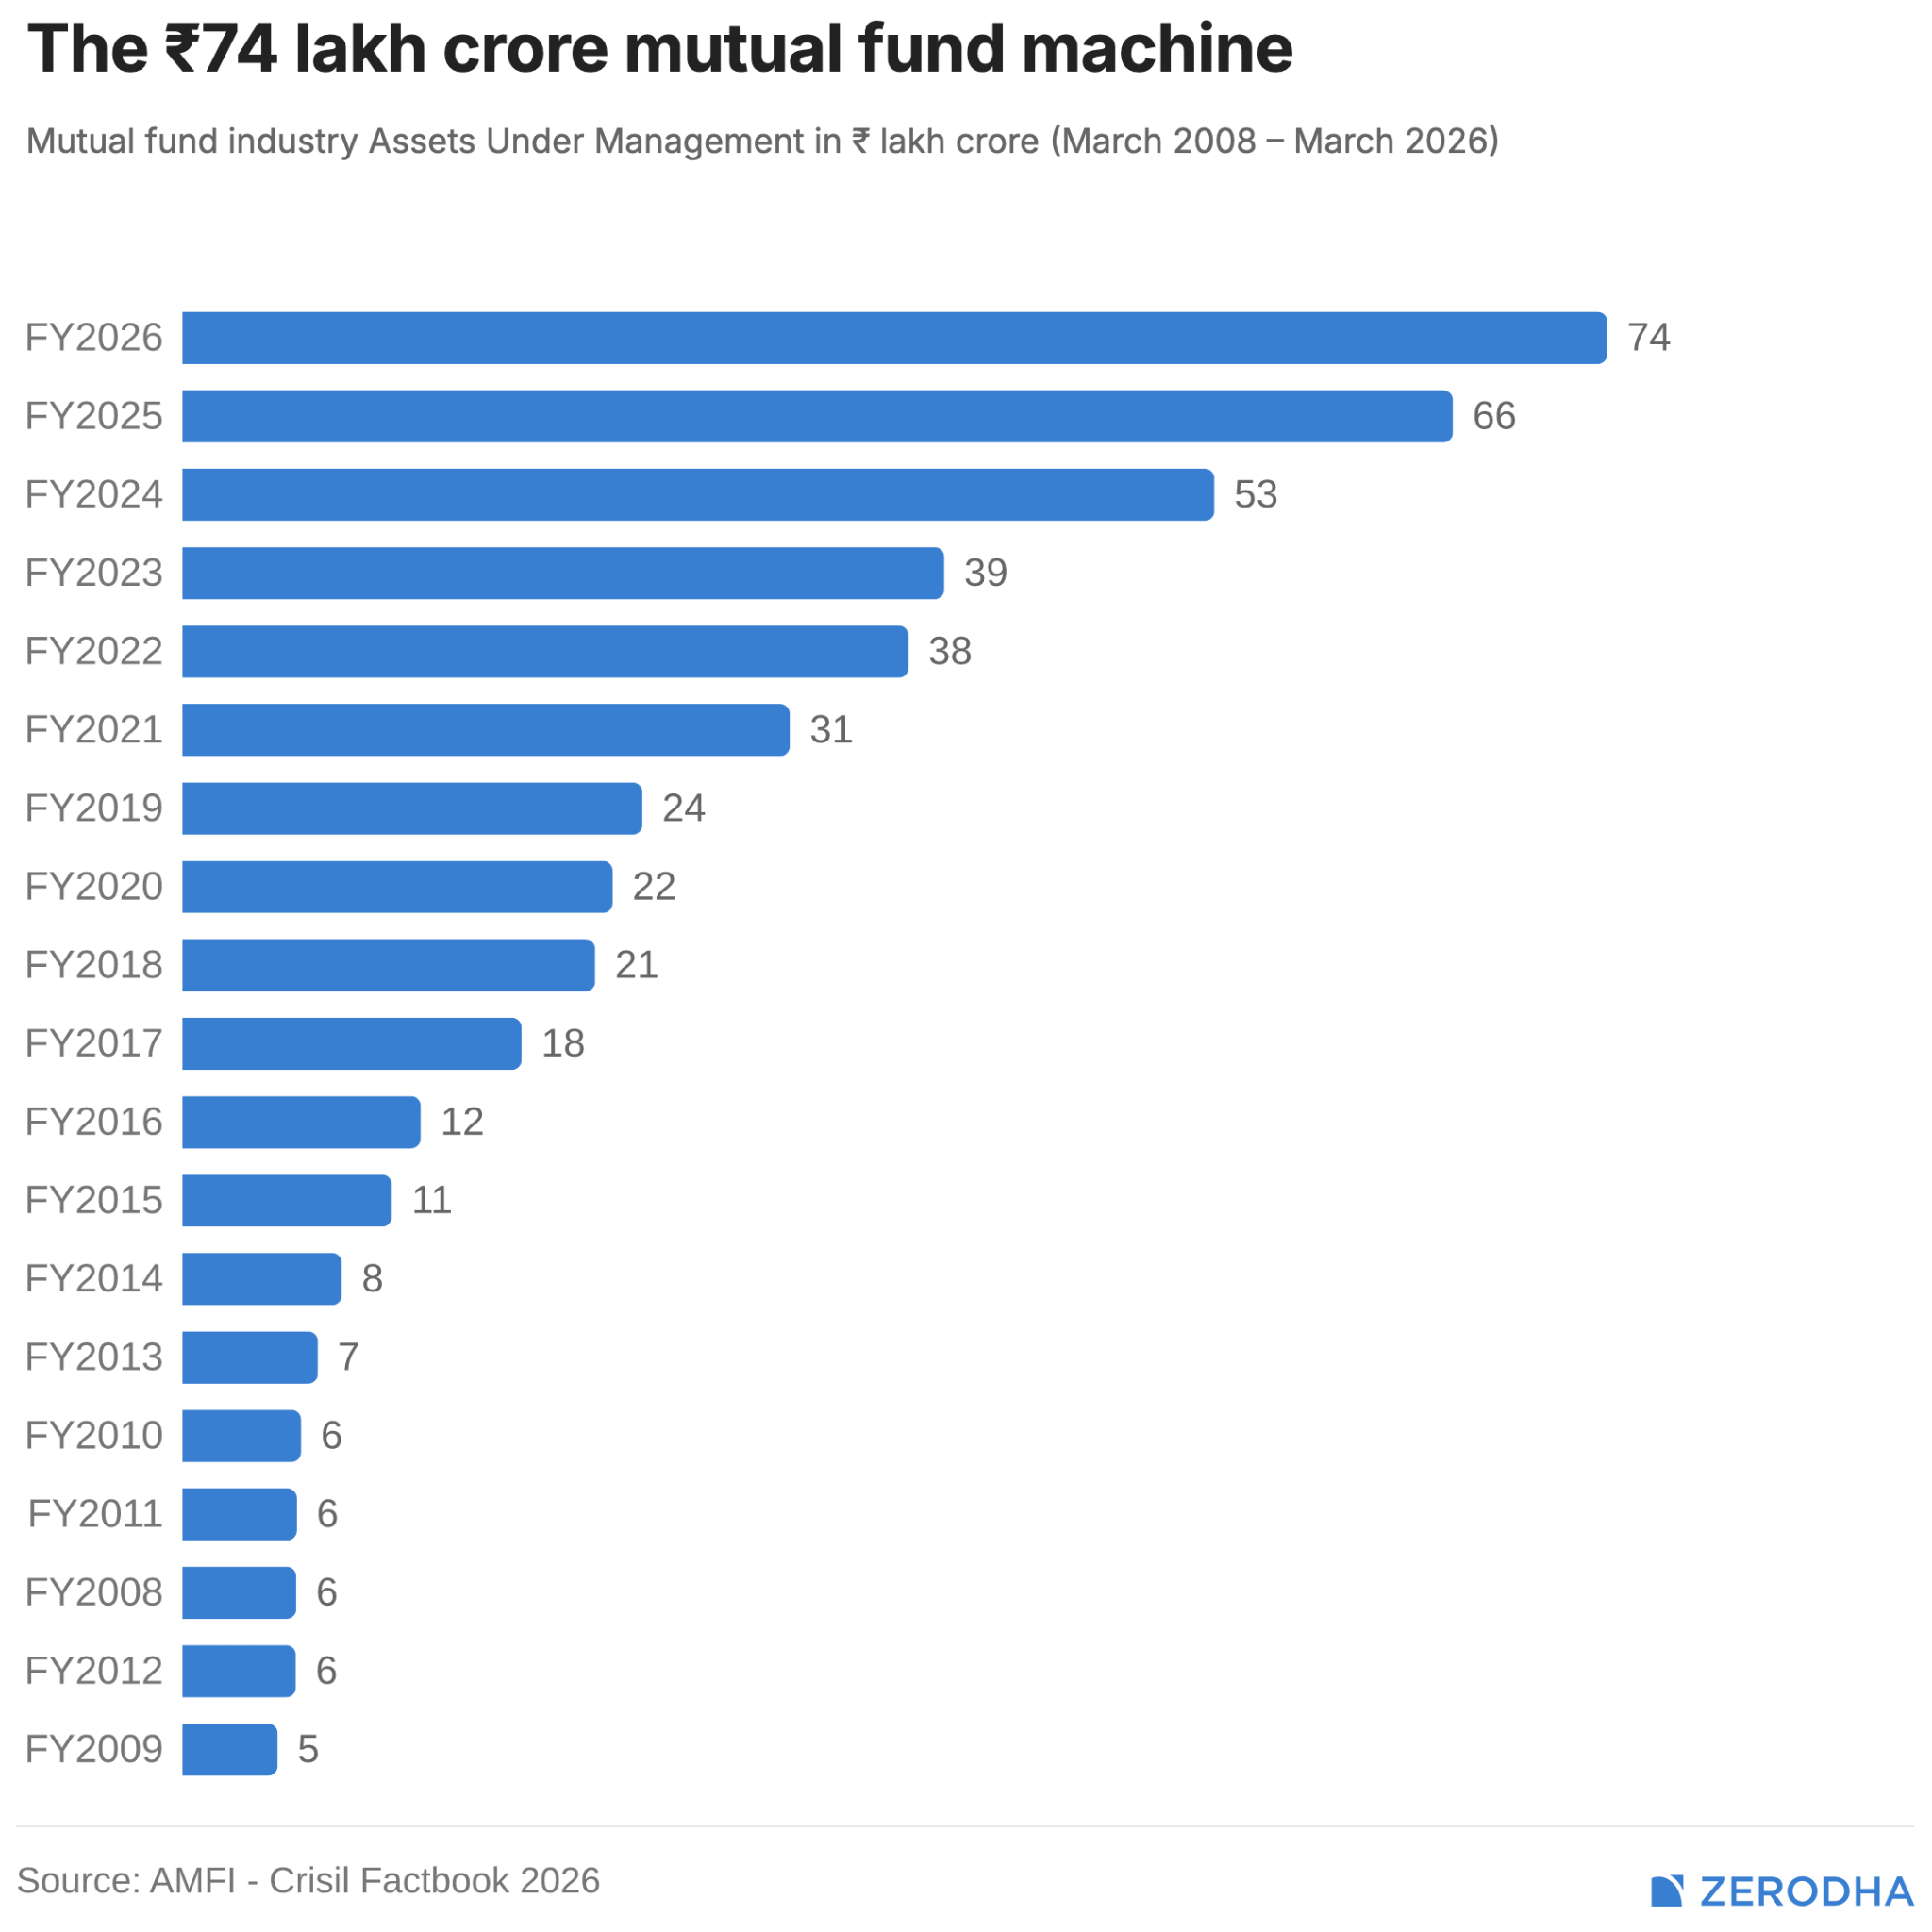
Some of this came from investors adding money, while some came from the assets inside the funds becoming more valuable. Equity enjoyed a strong run during much of this period, and equity schemes’ share of industry AUM rose from 31.2% to 43.4%.
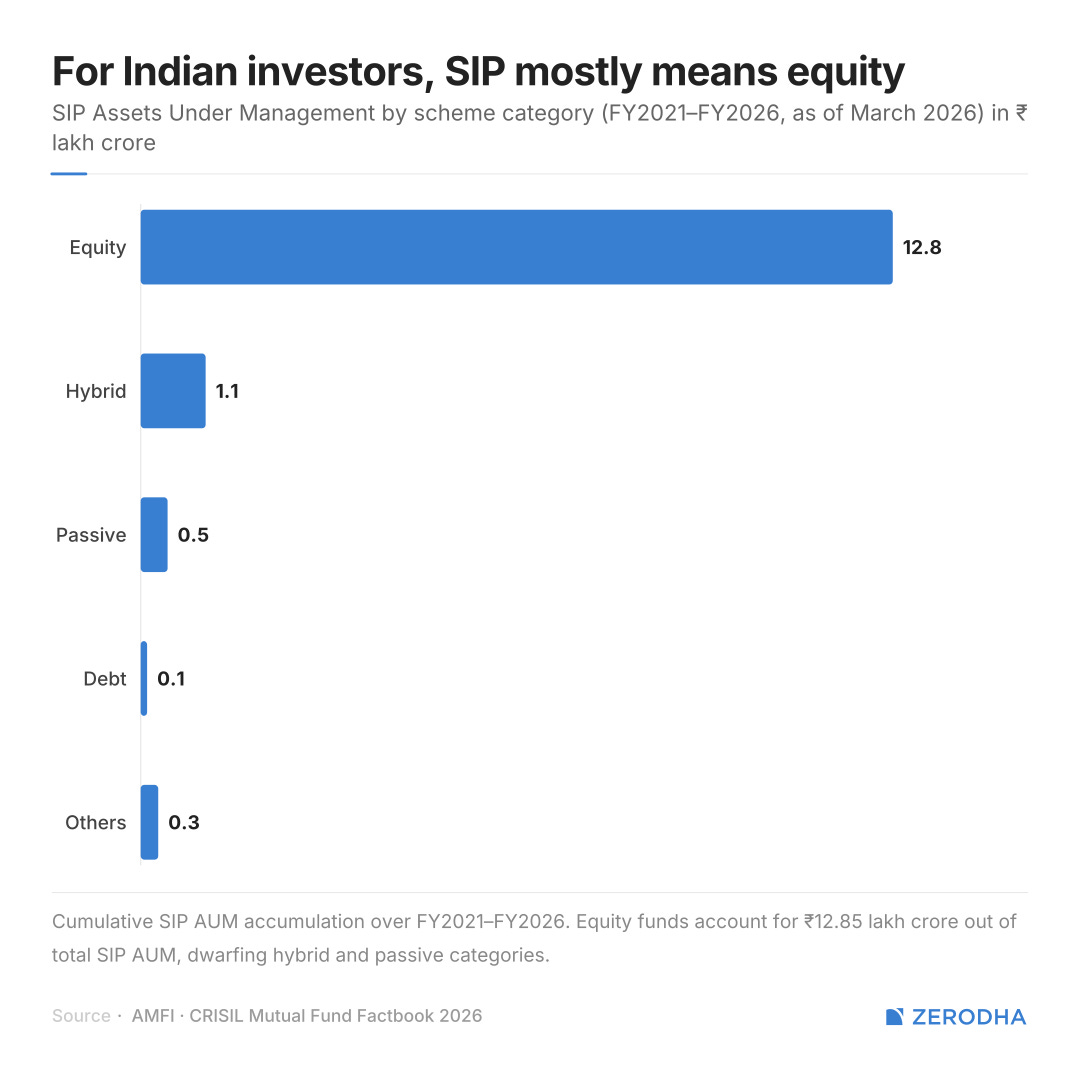
Mutual funds are taking up more space in the economy
In FY21, mutual fund AUM was equal to 15.9% of India’s GDP. By FY26, it had reached 21.3%.
Another number helps explain this change. Mutual funds accounted for 3% of the gross flow of annual household savings in 2020. By 2025, their share had risen to 13%.
This does not mean Indian households abandoned deposits, insurance, property or gold. It means that, within the money households saved during the year, mutual funds claimed a larger share than before.
India remains far below countries such as the US on the AUM-to-GDP measure. But countries have very different pension systems, income levels and financial markets, so the comparison is useful as context, not as a target India should necessarily reach.
Five years, nearly four crore new investors
A rising market can make an industry larger without bringing in anyone new. But that is not the full story here.
India’s unique mutual fund investor base grew from 2.3 crore in March 2021 to 6.1 crore in March 2026. The increase suggests that industry growth was supported by new participants as well as larger portfolios and market appreciation.
Awareness played a role. SEBI’s 2025 survey found that 53% of Indian households were aware of mutual funds and ETFs, making them the most widely recognised securities-market product.
Still, the 6.1 crore figure includes retail investors, HNIs and HUFs. It counts investors, not households, and cannot be directly compared with the survey’s household-awareness percentage. Awareness is clearly broader than participation, but these numbers cannot tell us the exact size of that gap.

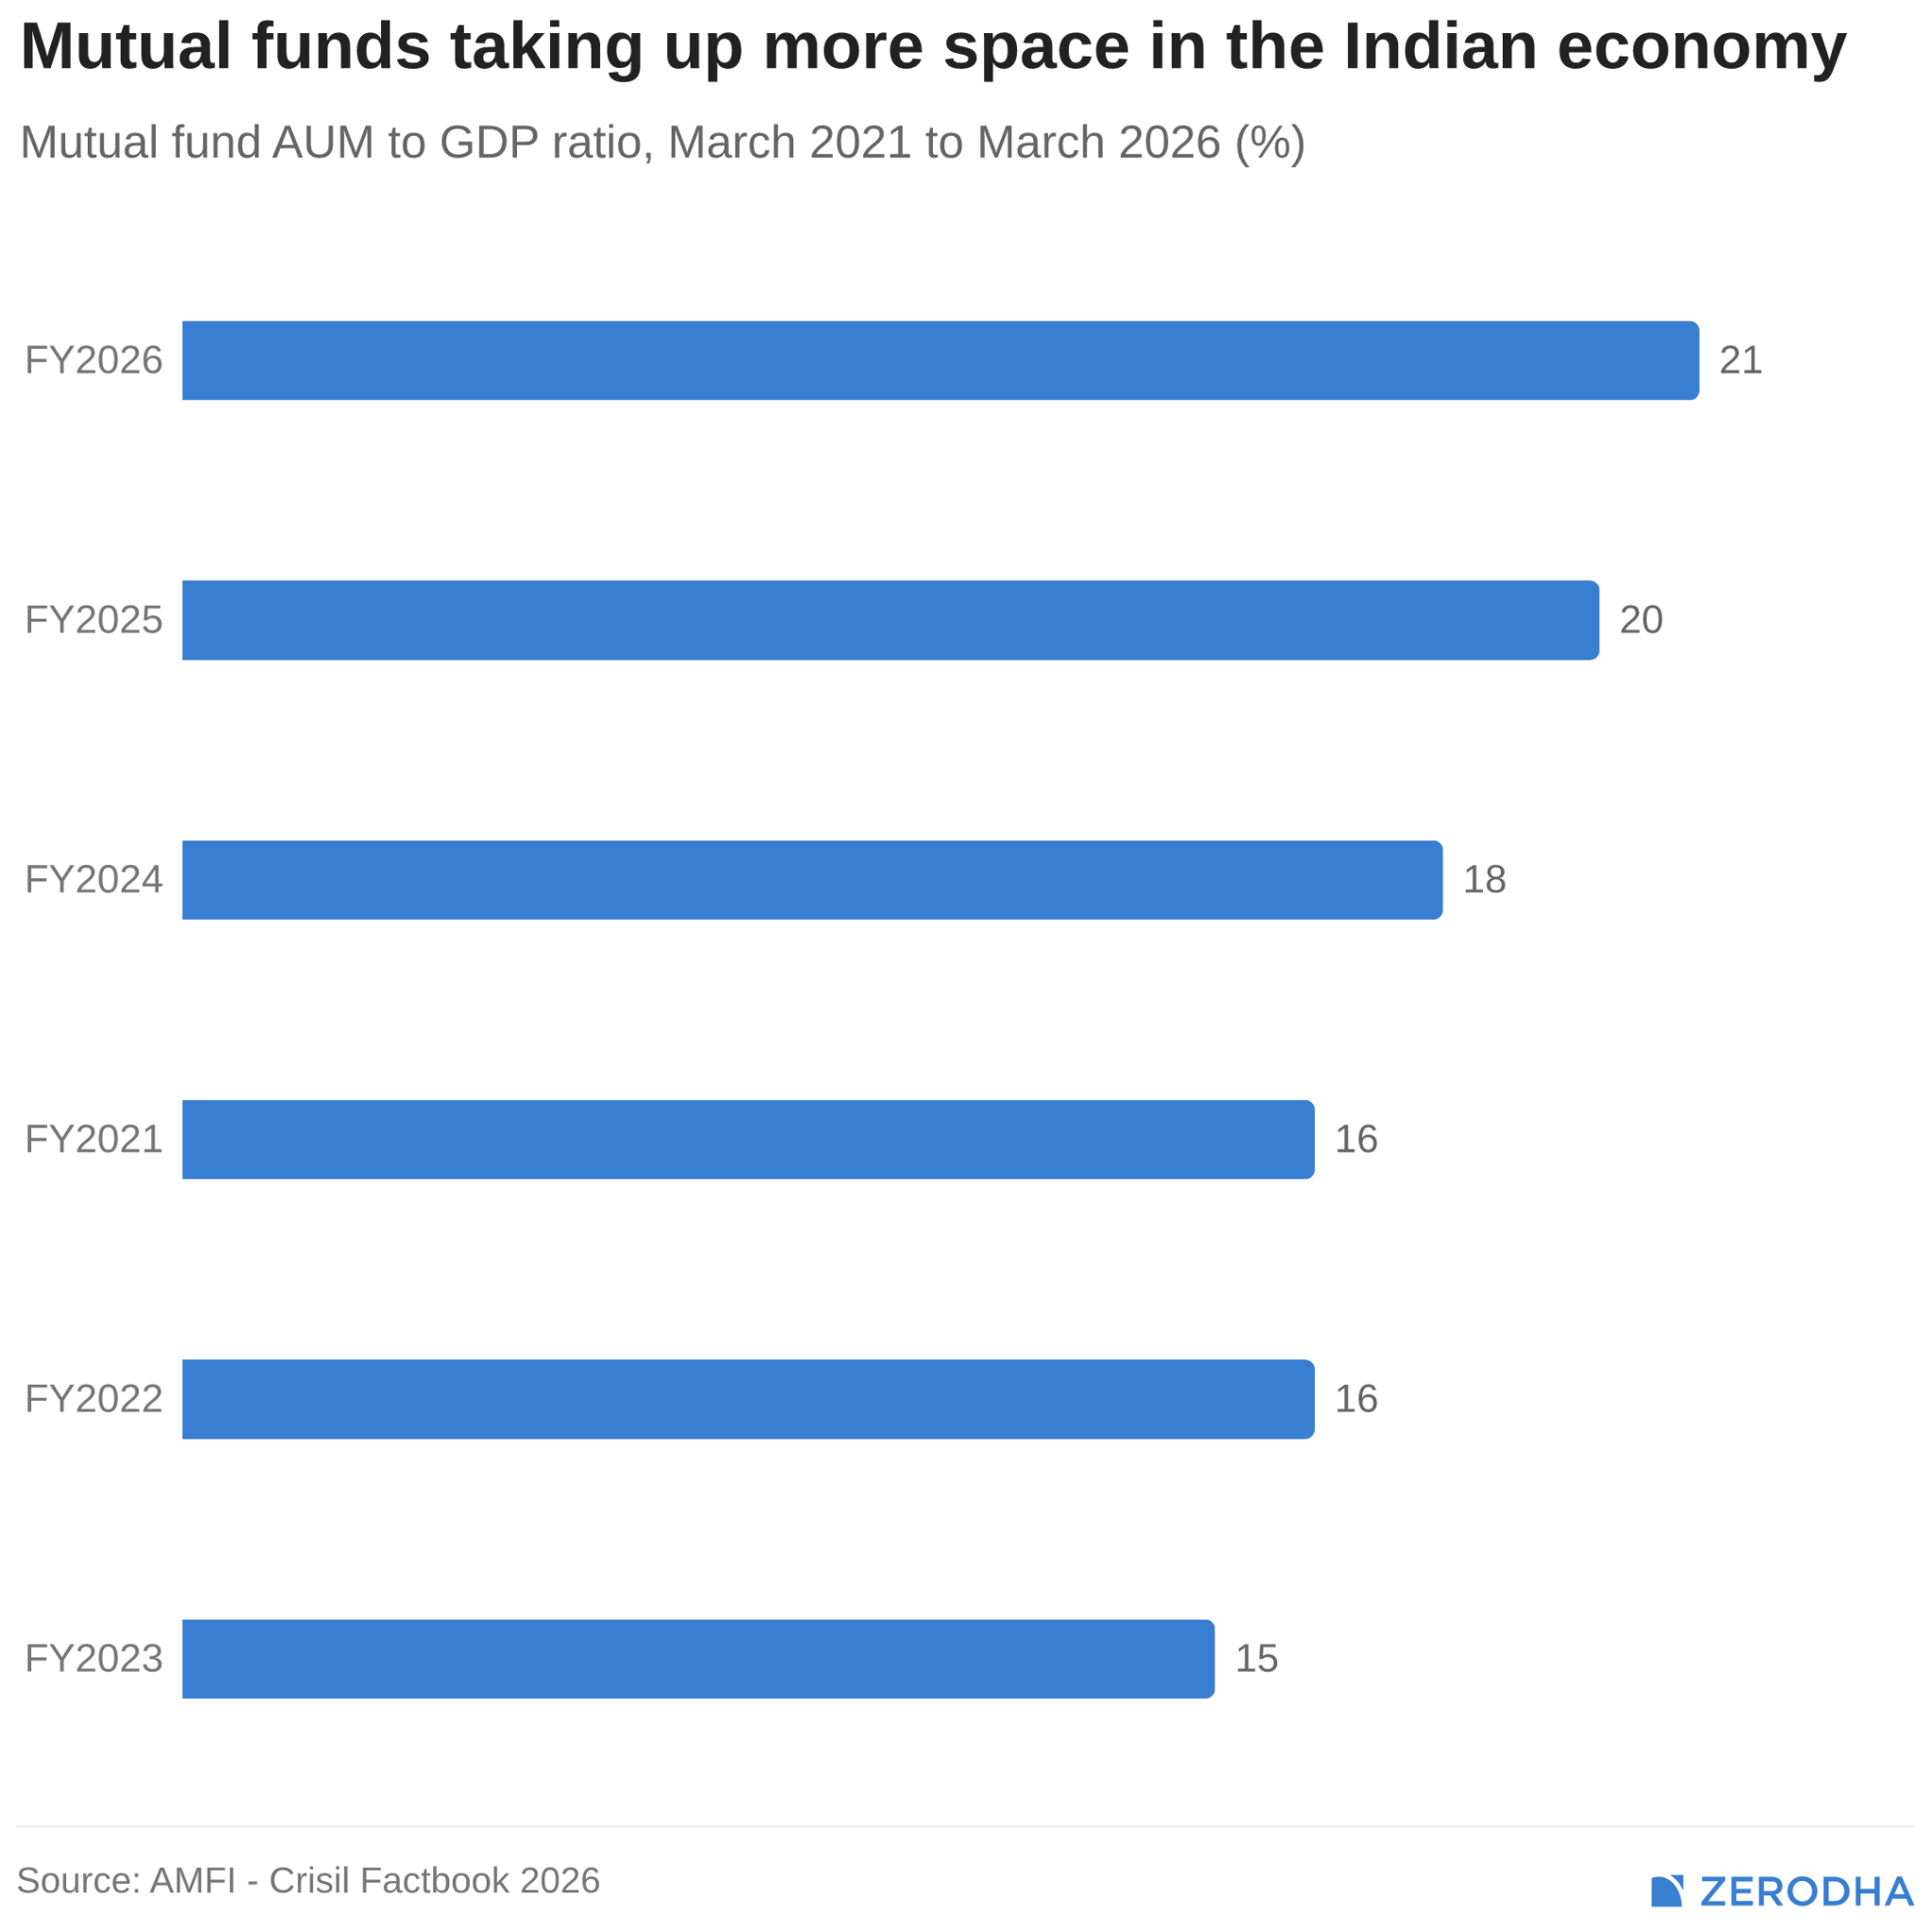
One in every five rupees is now SIP money
SIP AUM rose from ₹4.25 lakh crore in March 2021 to ₹14.83 lakh crore in March 2026. Its share of industry AUM increased from 13.5% to 20.1%.
The longer history is even more striking. Monthly SIP contributions rose from ₹4,335 crore in March 2017 to ₹32,087 crore in March 2026. Around 76% of the cumulative gross SIP inflows recorded during these nine years arrived in the most recent five years.
But SIP AUM is not the amount contributed every month. It is the accumulated value of investments made through SIPs, including the effect of market gains and losses.
A growing share of SIP money is staying beyond five years
The SIP pool is not just larger; its age profile has changed.
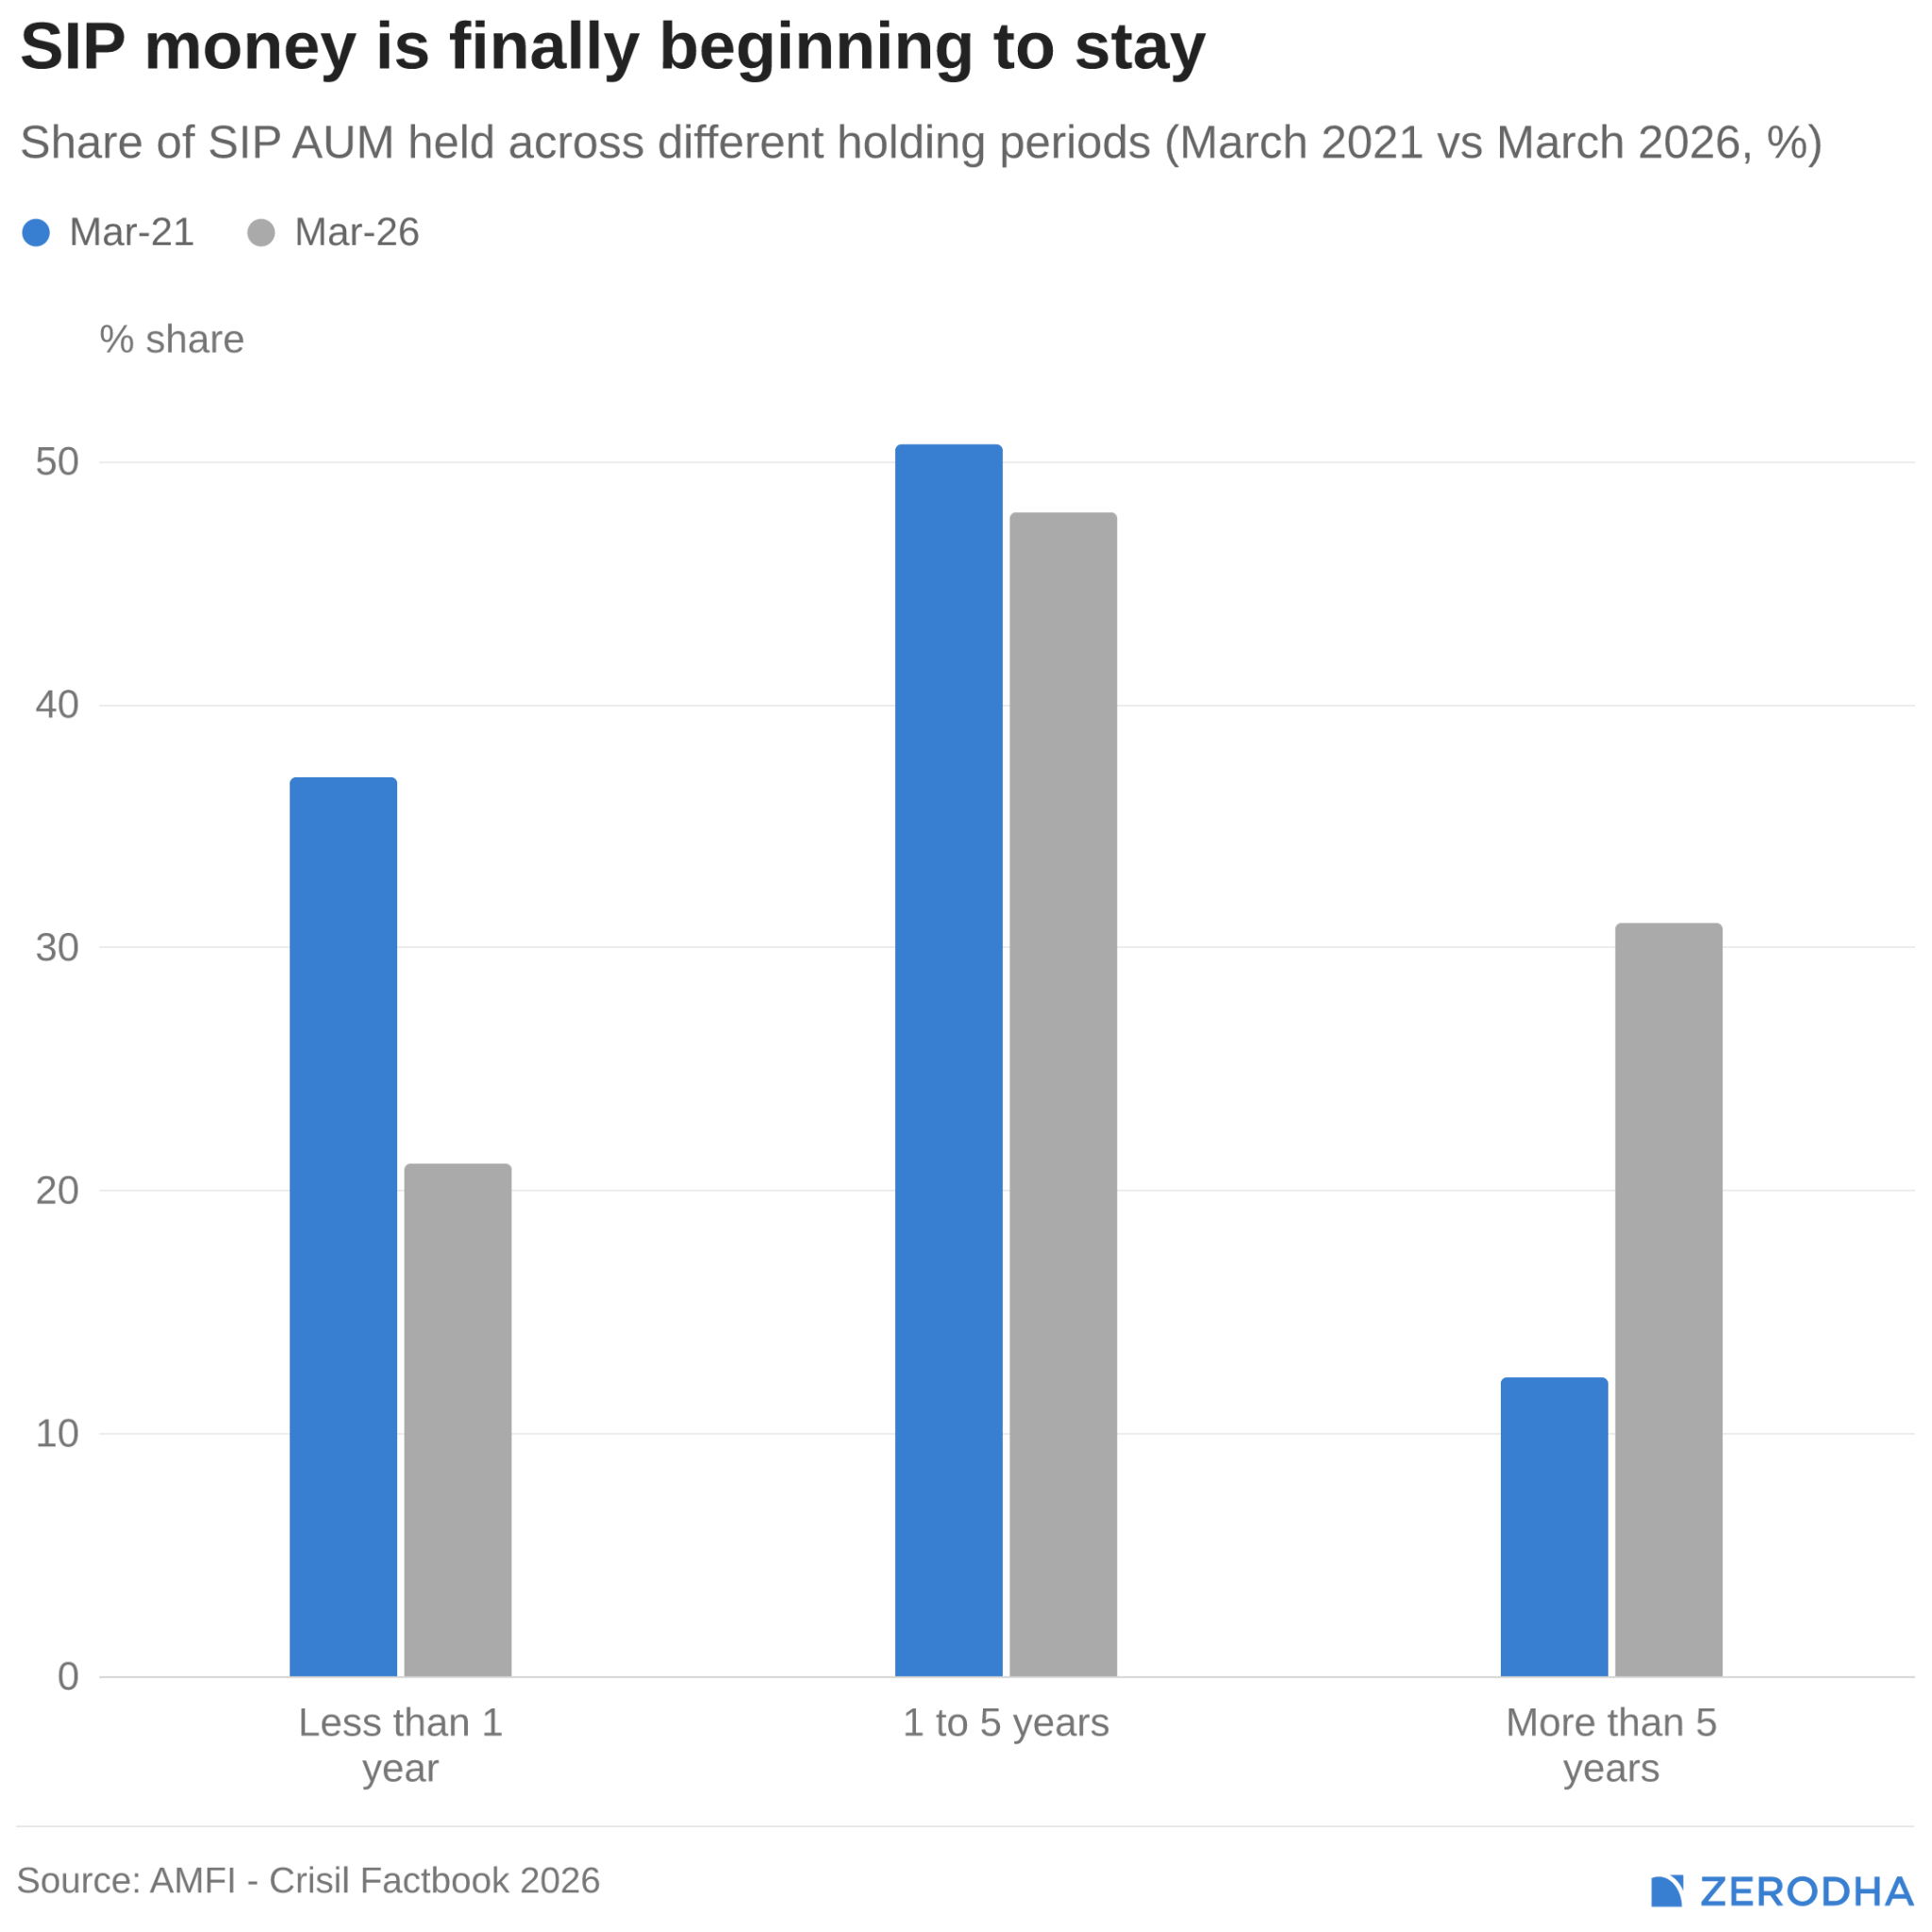
The share of SIP AUM held for more than five years rose from 12.3% in March 2021 to 31% in March 2026. The share less than one year old fell from 37% to 21.1%.
This is important because investor enthusiasm is easier to sustain when markets are rising. By FY26, equity returns had become less exciting than during the earlier part of the period, but monthly SIP contributions remained high and a larger share of SIP assets sat in older holdings.
However, this is not an SIP-retention rate. It does not tell us whether every instalment continued uninterrupted. It only shows how SIP AUM was distributed across holding-period buckets.
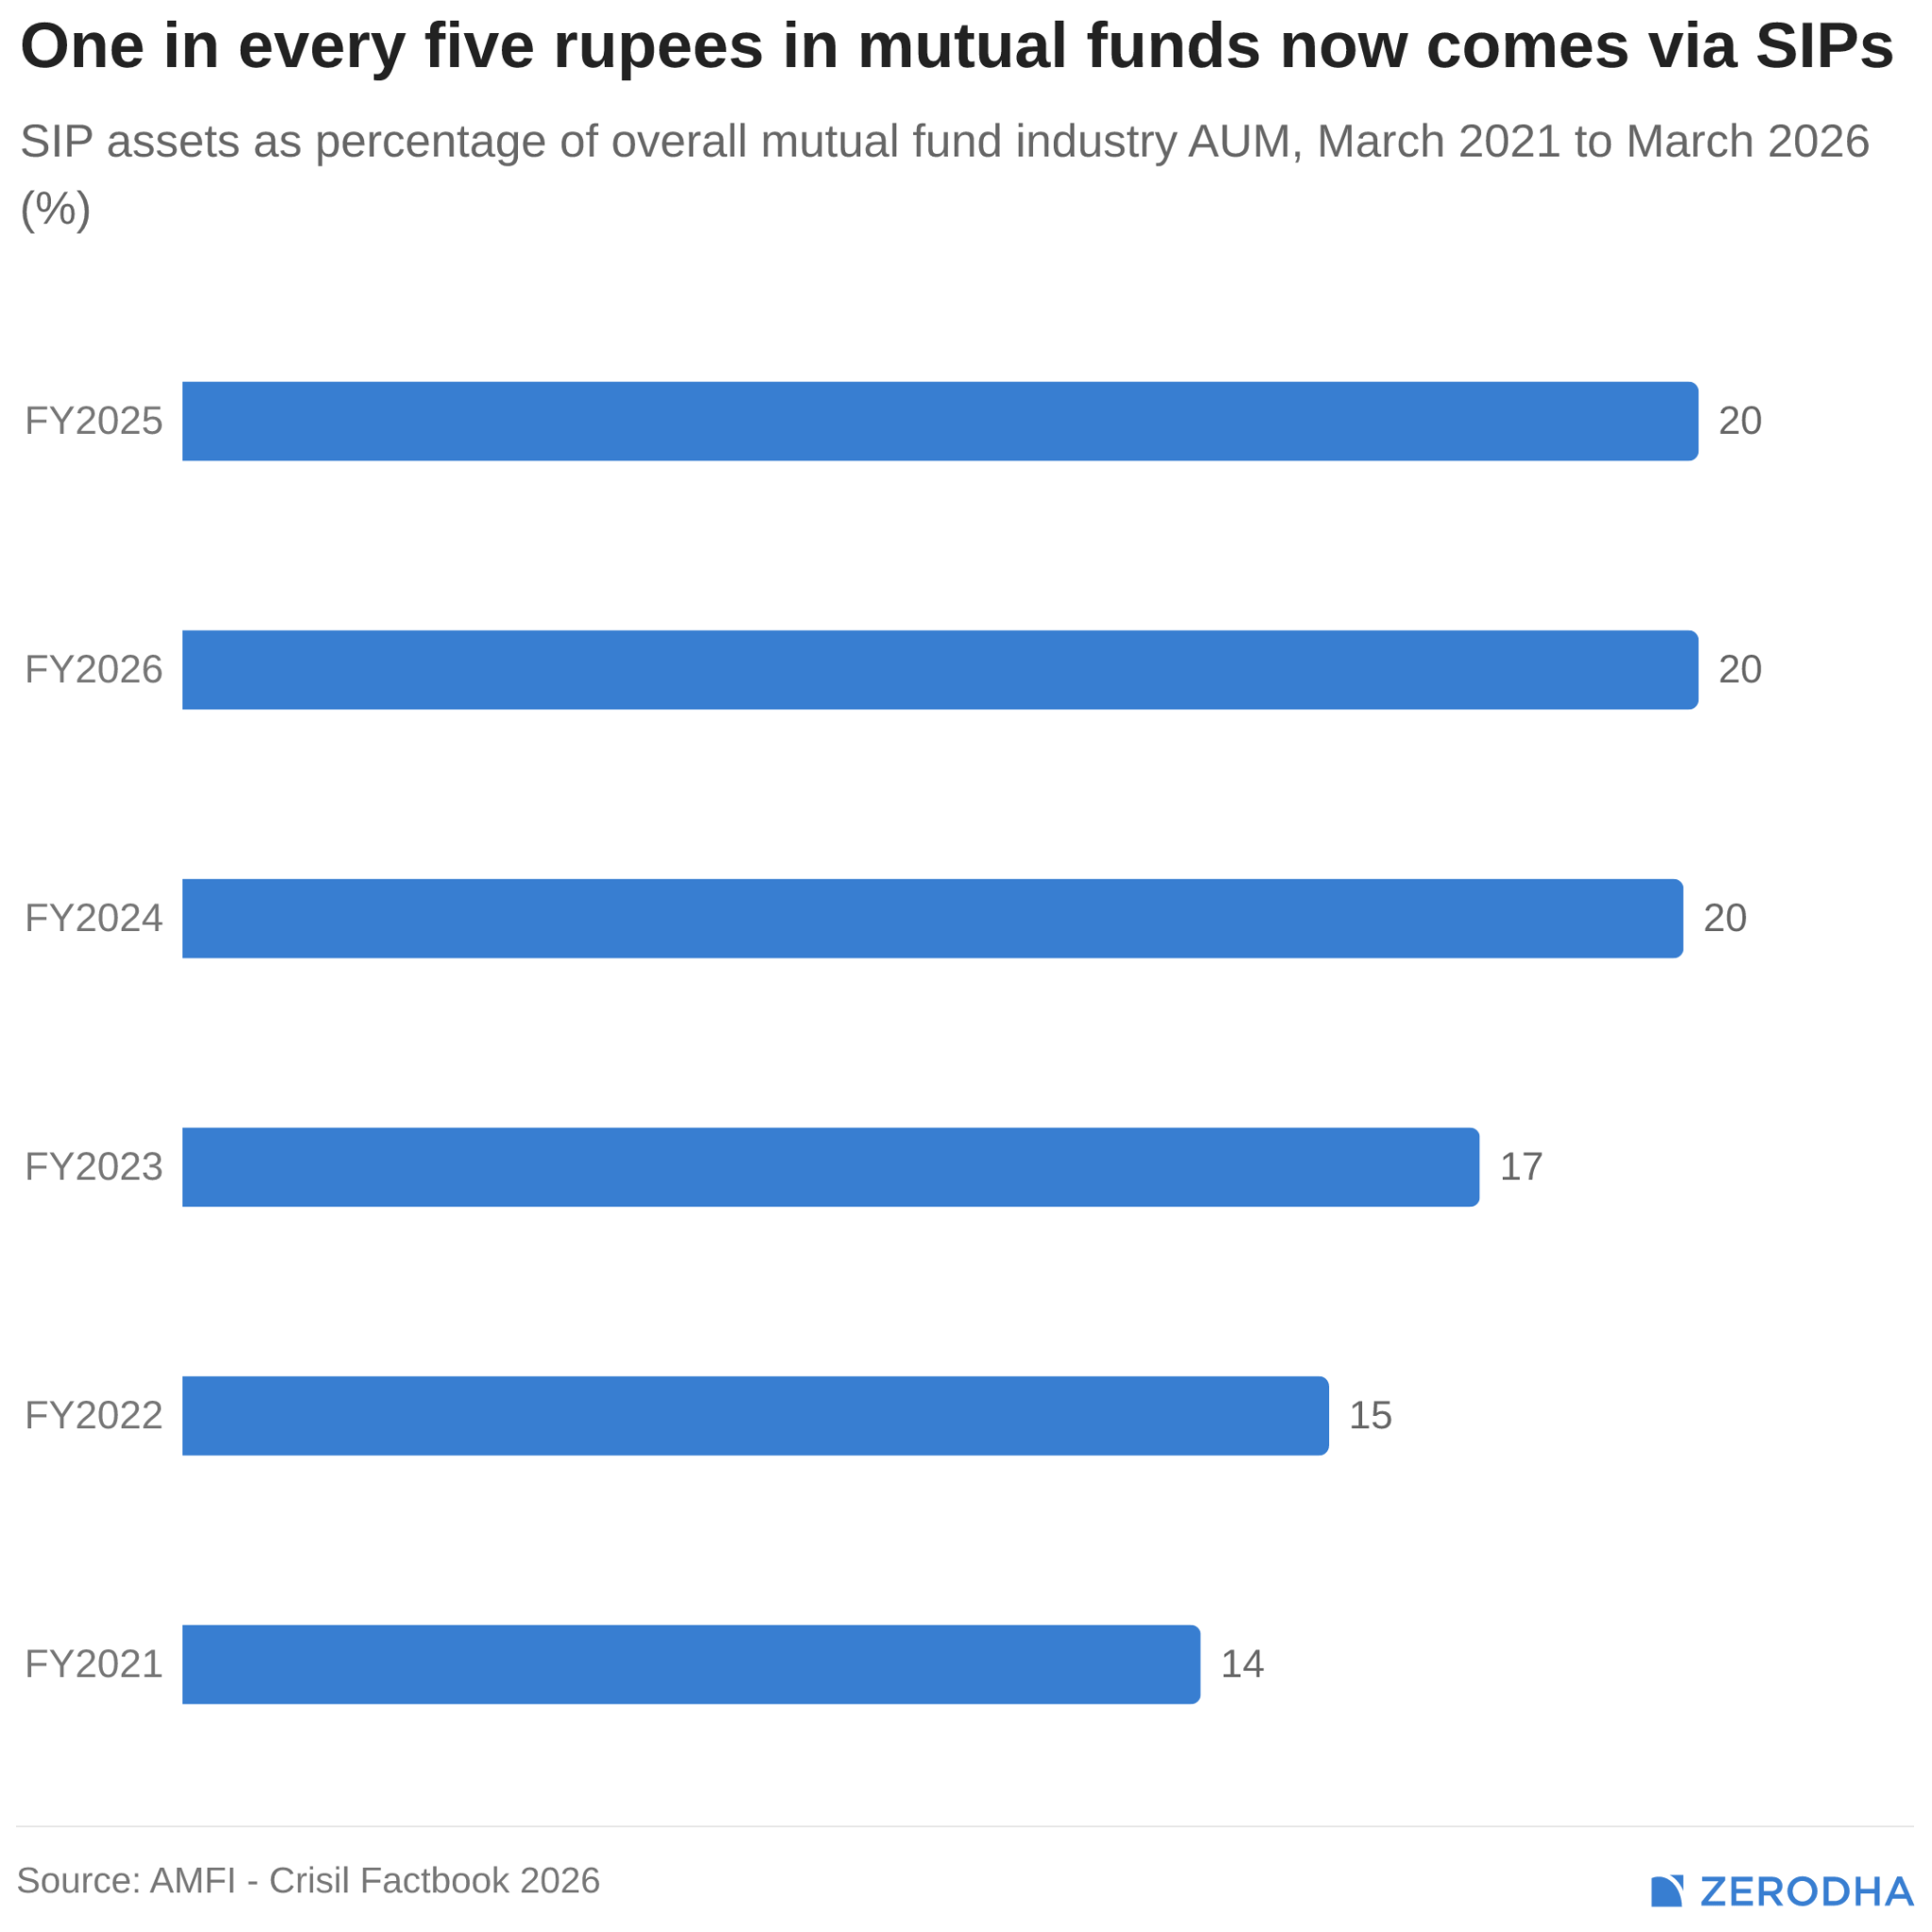
For Indian investors, SIP mostly means equity
An SIP is a way of investing, not an asset class. But roughly 87% of SIP AUM was held in equity-oriented schemes in March 2026, ₹12.85 lakh crore out of ₹14.83 lakh crore.
This steady flow of domestic money has also changed the market’s ownership. Domestic mutual funds’ share of the total market capitalisation of NSE-listed companies rose from 7.2% in March 2021 to 11.4% in March 2026. In FY26, mutual funds invested ₹5.35 lakh crore in equities while foreign institutional investors were net sellers.
This does not mean SIPs alone supported the market: the ₹5.35 lakh crore includes equity purchases by mutual funds from different sources, not only SIPs. But the expanding SIP pool contributes to a larger, more regular domestic source of equity capital.
SIP AUM represented 55% of small-cap fund AUM in March 2026. It represented 47% of mid-cap AUM and around 40% of large-cap and large-and-mid-cap AUM.
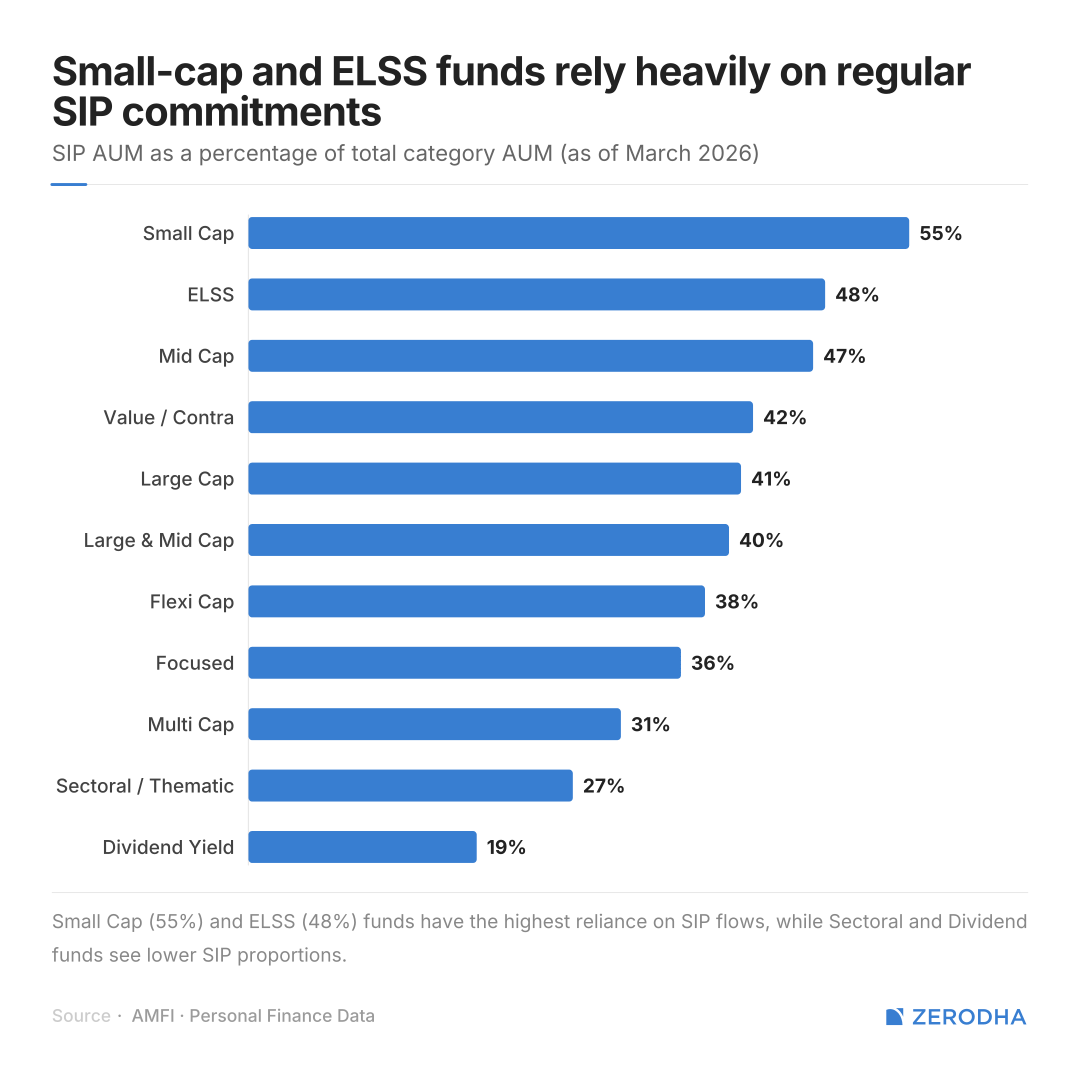
Small-caps also went from 8.3% of total SIP AUM in March 2021 to 12.1% in March 2026. Mid-caps became the largest SIP category, accounting for 13% of SIP AUM.
This fits the strong interest in smaller companies during much of the period. But it is important to read the chart correctly: 55% of small-cap AUM being linked to SIPs does not mean 55% of all SIP money went into small-caps.
SIPs spread purchases over time. They do not remove the higher volatility associated with smaller companies.
The passive boom has several stories inside it
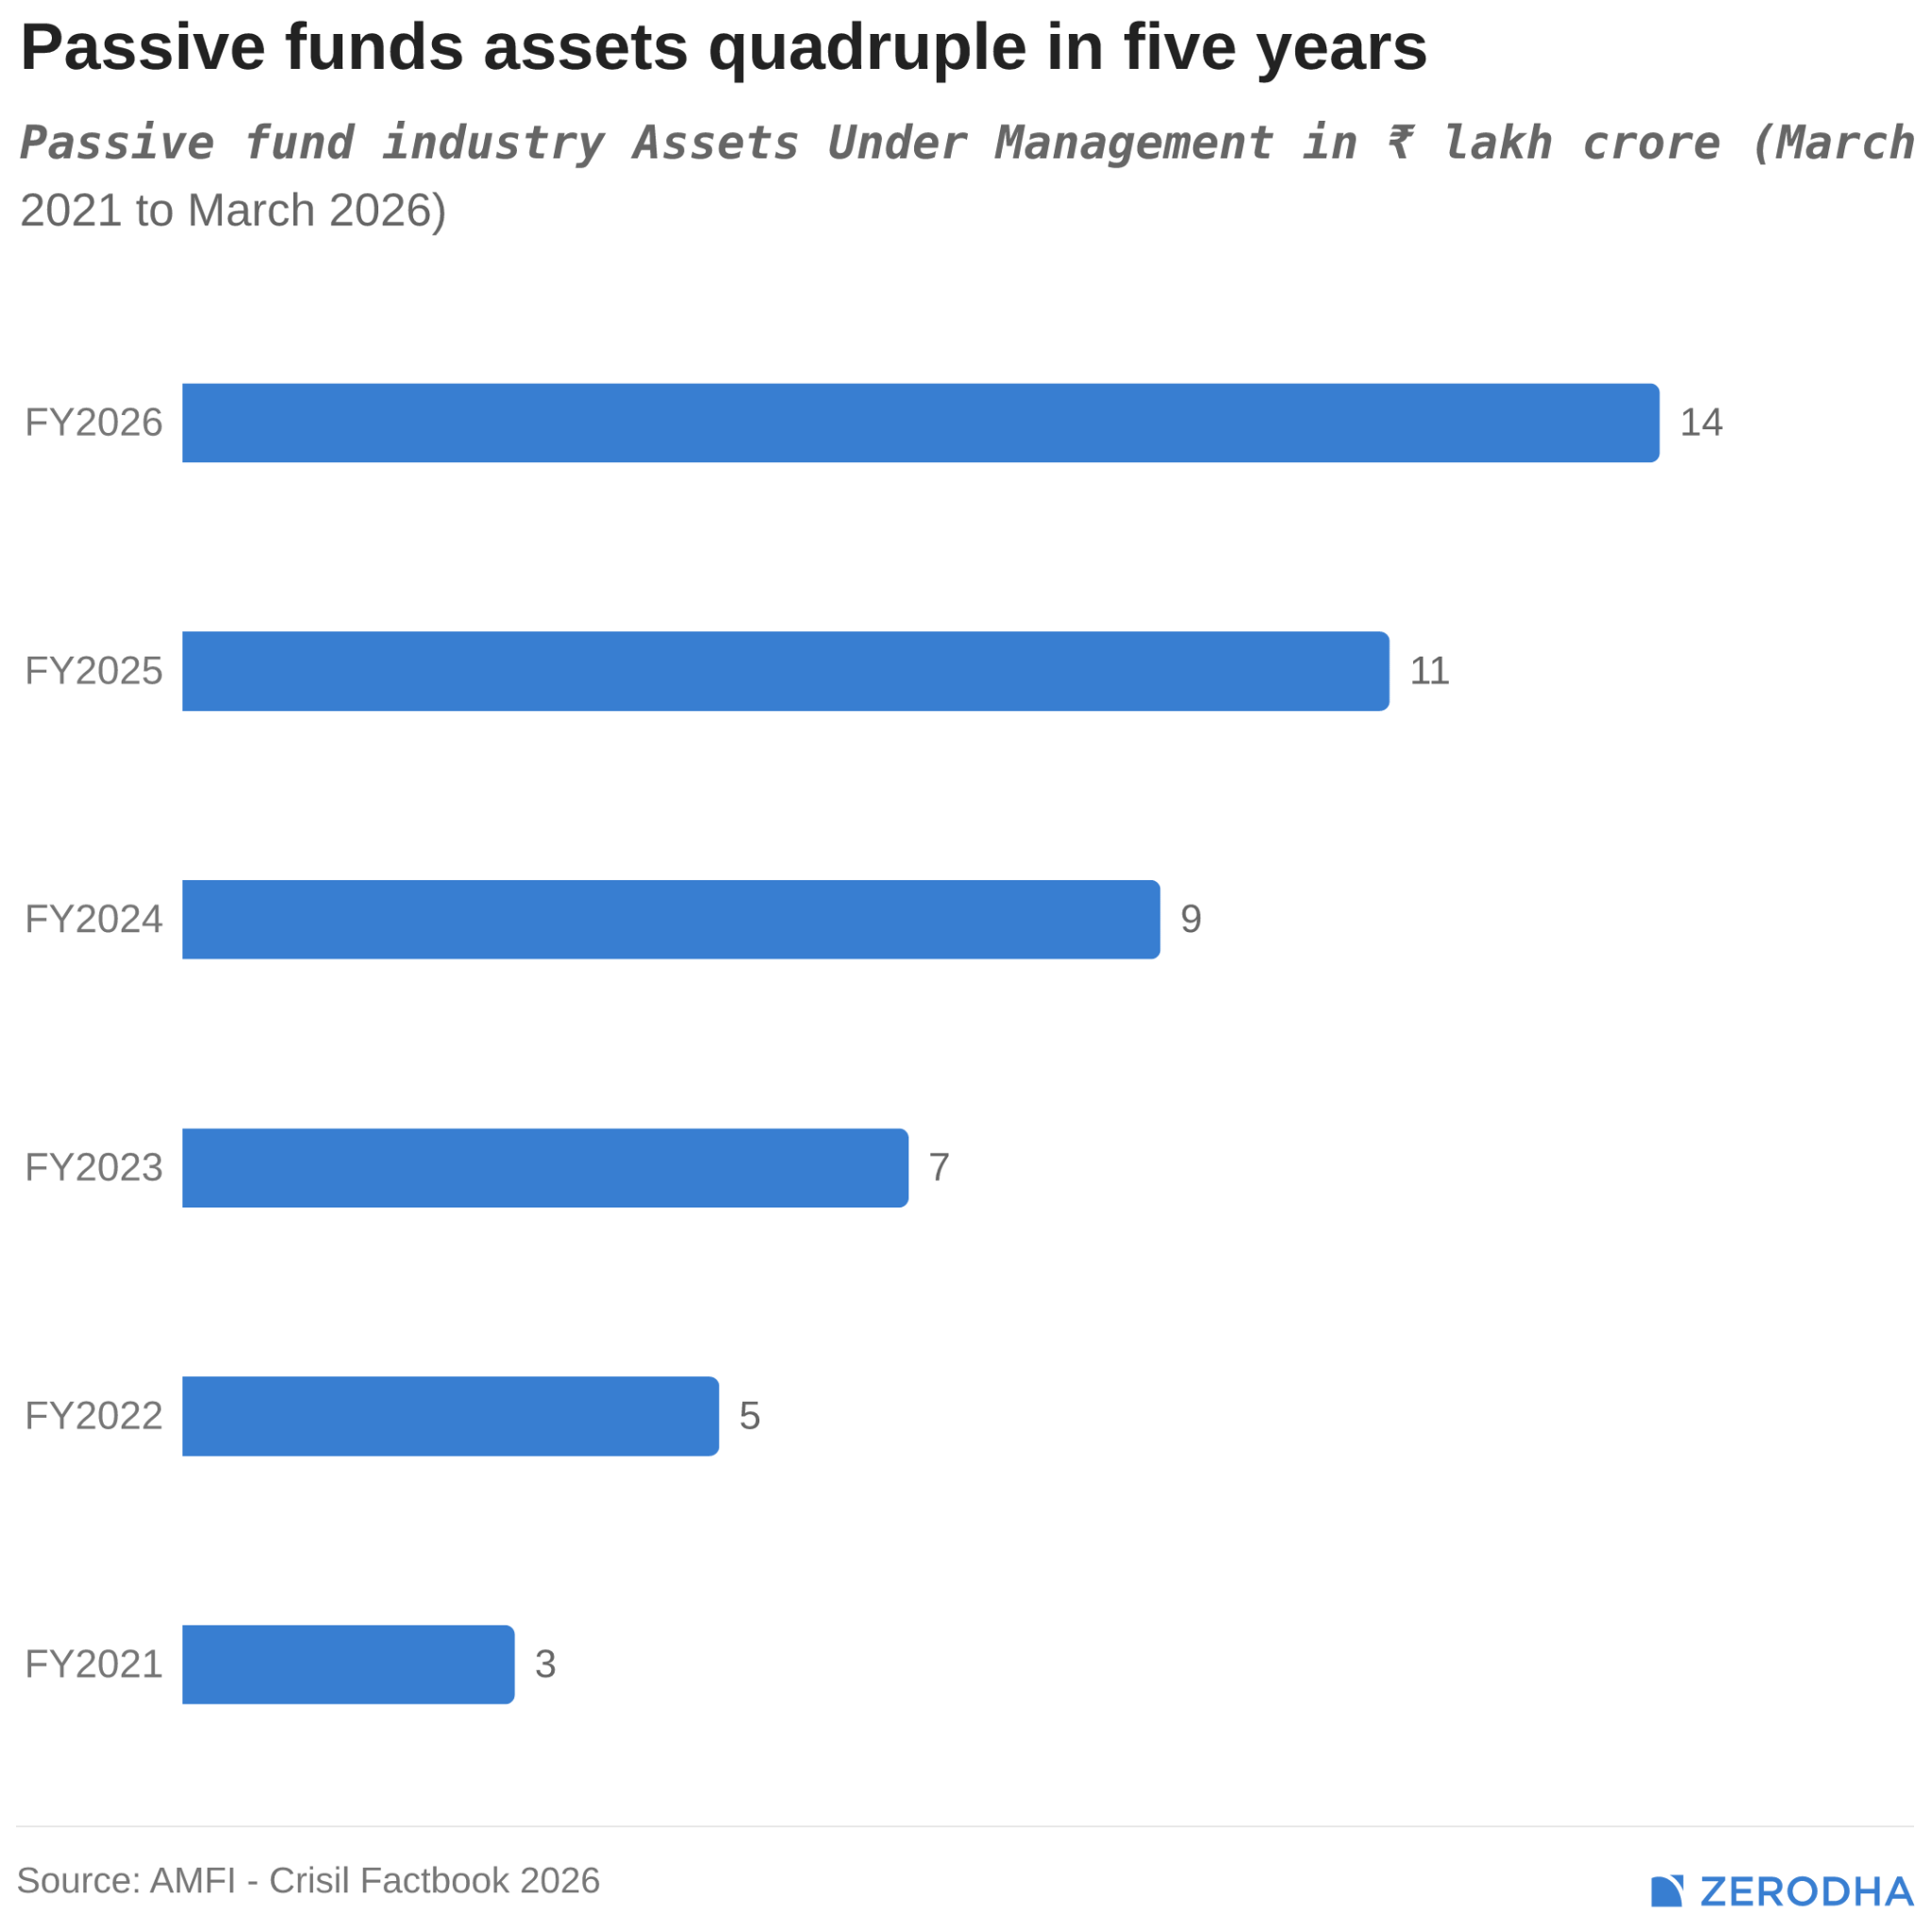
Passive fund AUM reached ₹13.73 lakh crore in March 2026, around four times its March 2021 level. Its share of industry AUM rose from 9.8% to 18.6%.
Index funds became more important, particularly for retail investors. Their share of retail passive AUM increased from 11.5% to 55%.
But the overall passive industry is not purely a retail story. Corporates held 69.6% of passive AUM, largely through ETFs. FY26 growth was also helped by inflows and price gains in gold- and silver-linked products. Therefore, the rise in passive AUM combines corporate ETF holdings, retail index investing and greater demand for commodities.
The regulatory environment is also becoming friendlier to passive-only fund houses. SEBI introduced its lighter MF Lite framework for passively managed schemes in December 2024. The framework is intended to reduce entry barriers and compliance requirements for passive products.
Direct investing is rising, but regular plans still lead
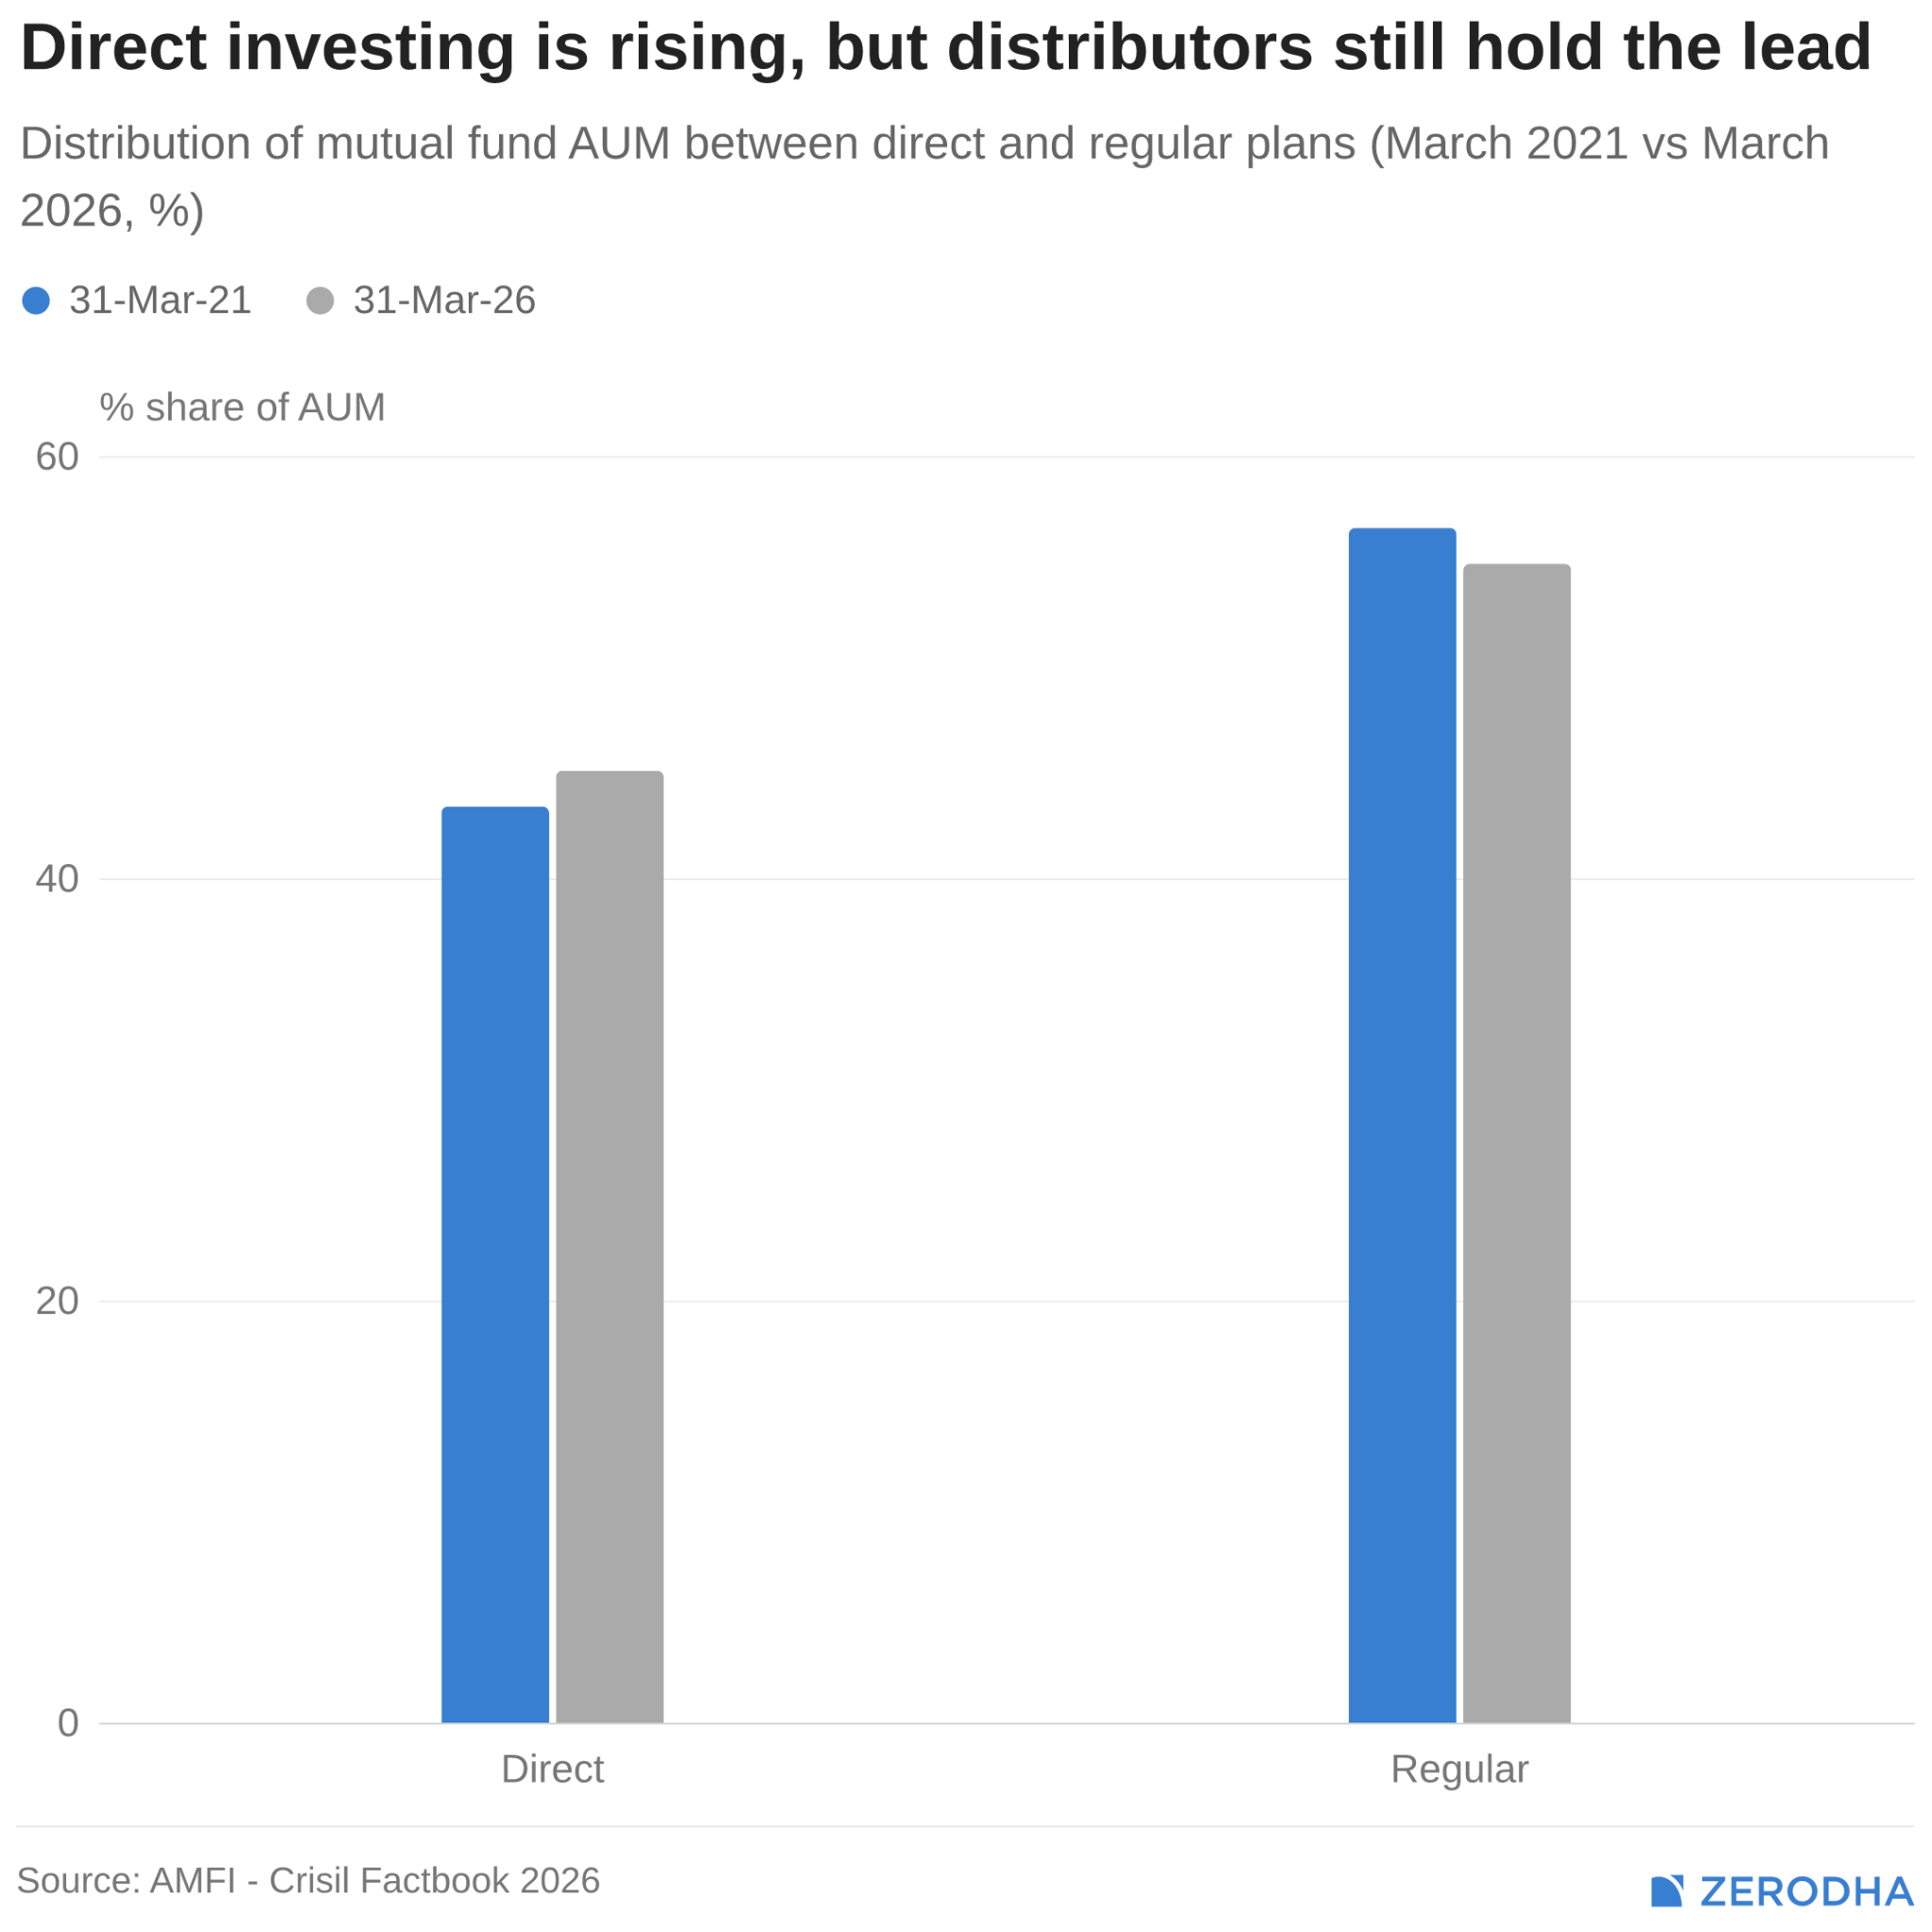
The direct share of industry AUM increased only slightly, from 43.4% to 45.1%. But among retail investors, it rose from 21.4% to 36.7%.
Direct and regular plans hold the same underlying portfolio, but direct plans exclude distribution commissions and therefore have lower expenses. Even with that cost advantage, nearly two-thirds of retail AUM remained in regular plans.
Access is only one part of investing. Some investors still rely on distributors to select funds, complete transactions or navigate market volatility. But the data does not show what service each investor received, so regular-plan AUM should not automatically be described as “advised money”.
The boom is spreading, but unevenly
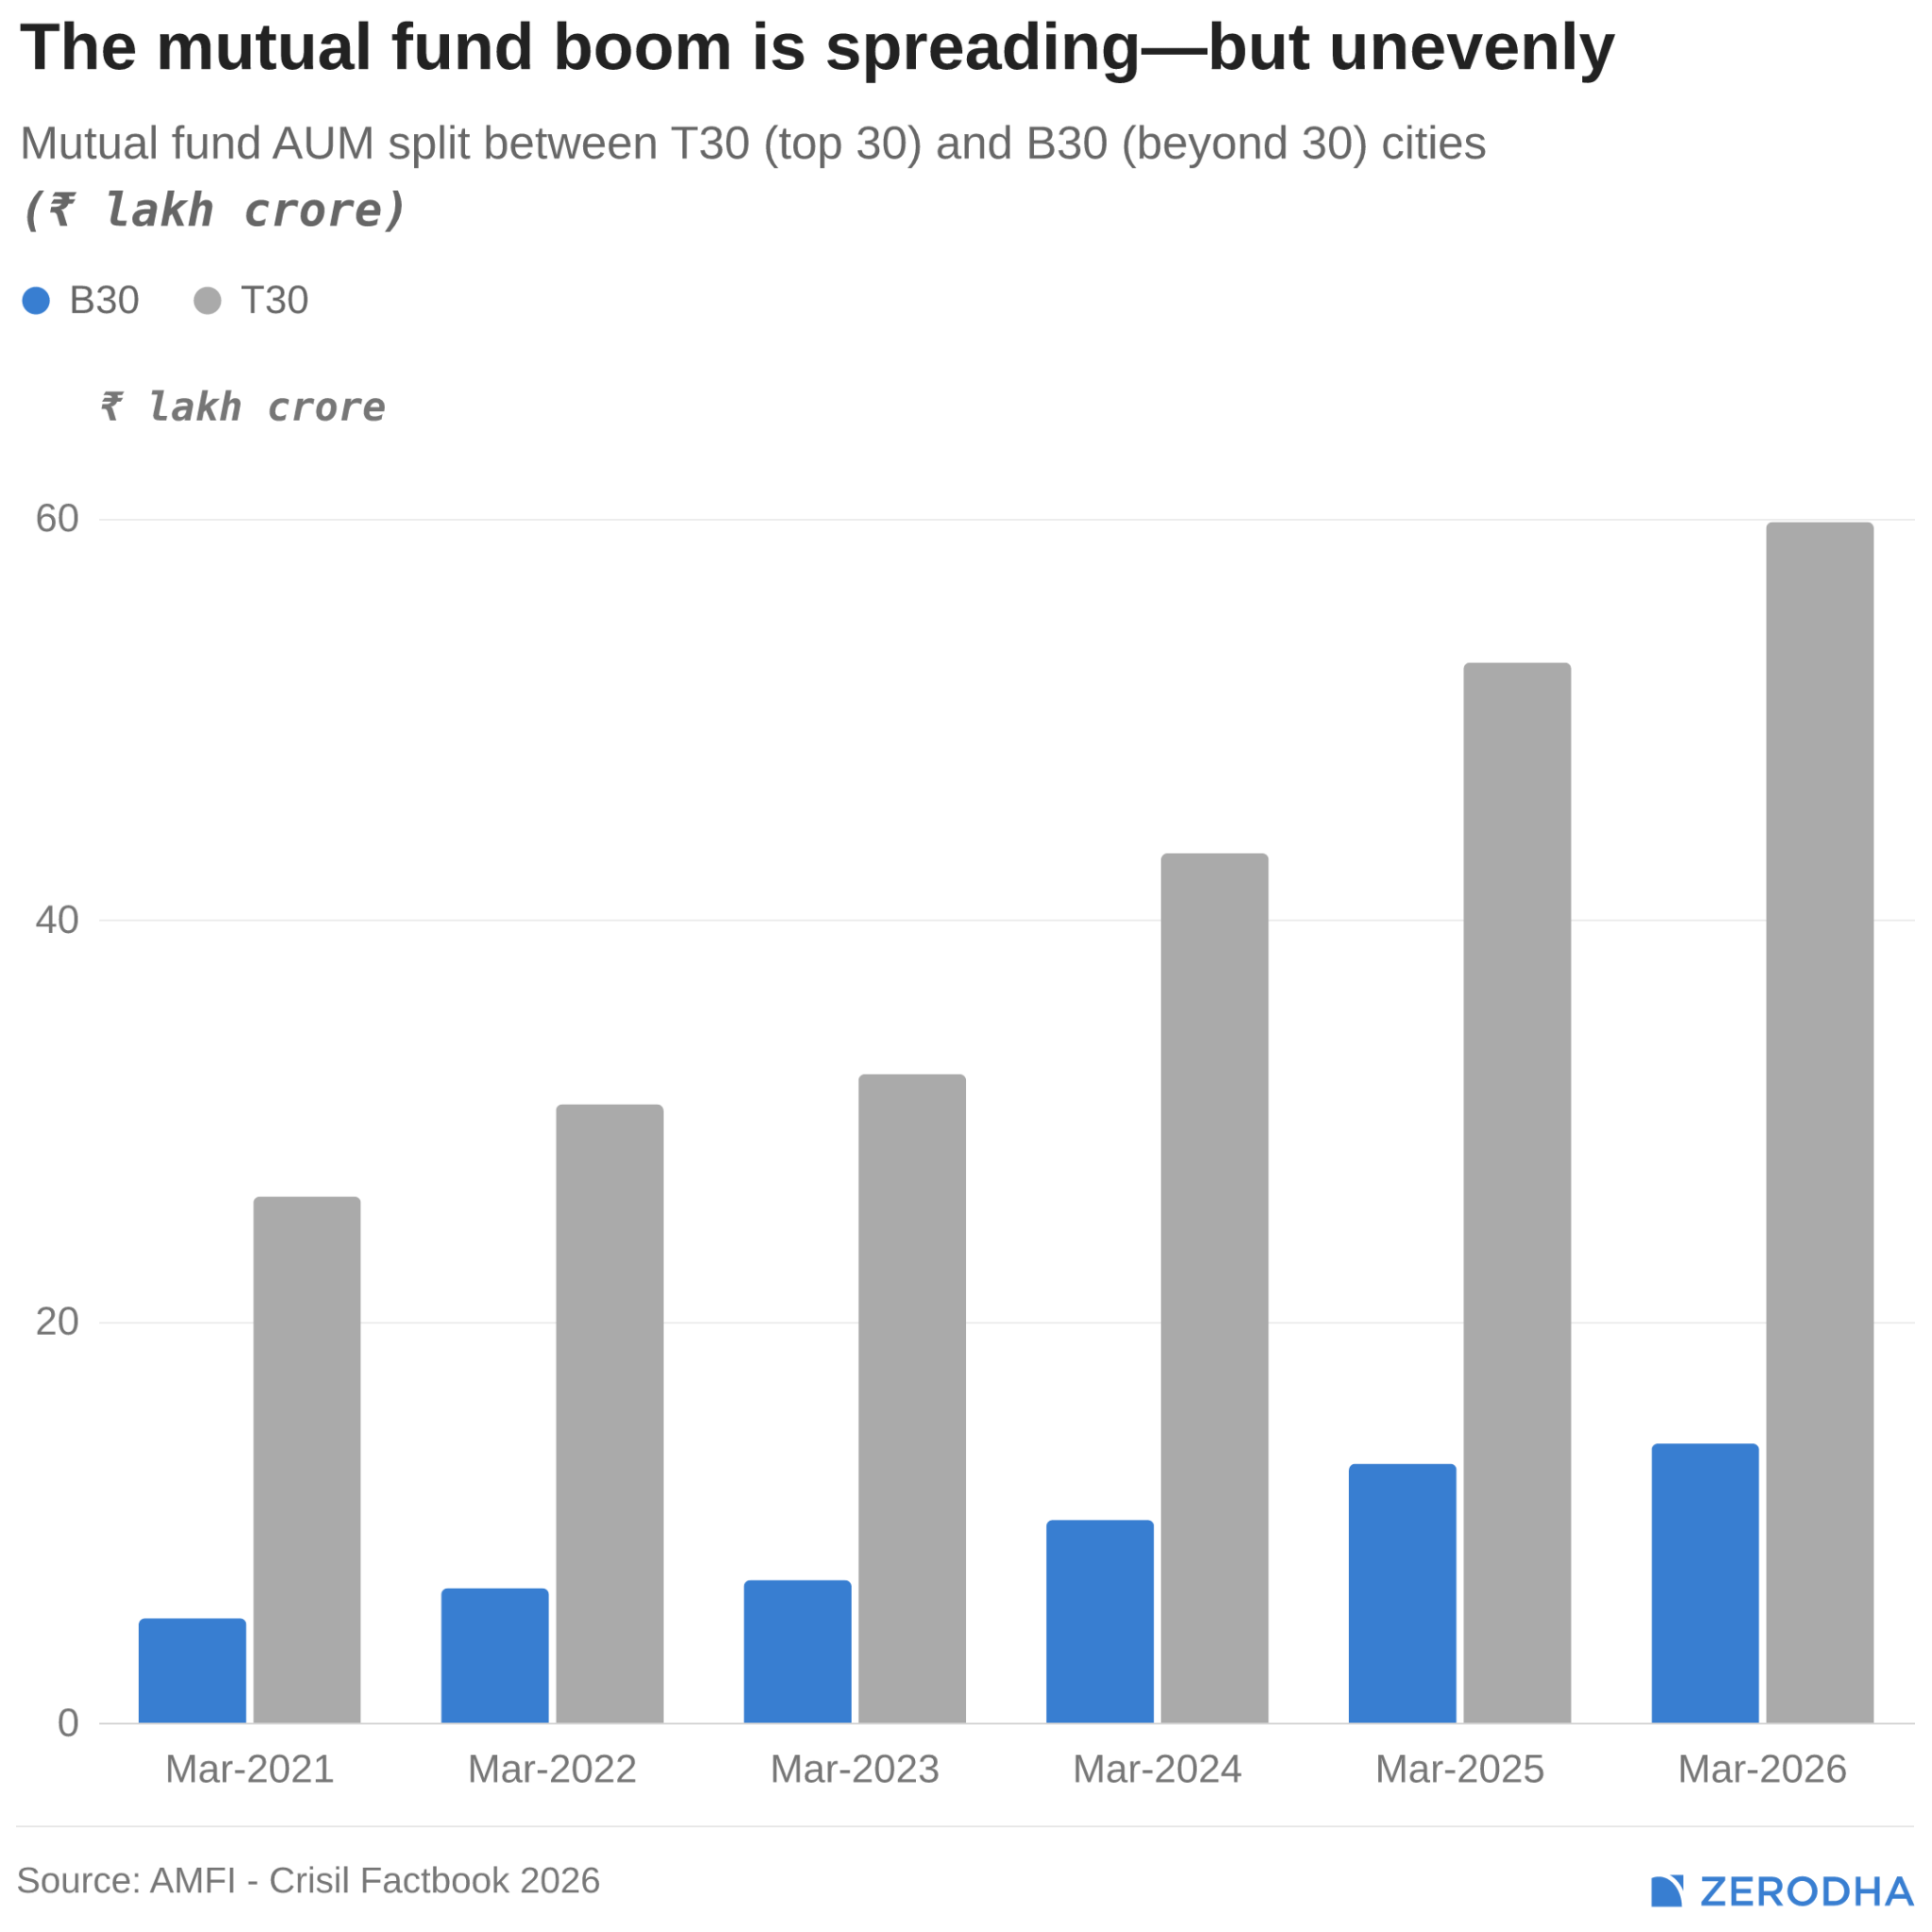
AMFI divides locations into T30 and B30. T30 comprises the 30 locations with the highest mutual fund AUM. B30 covers all locations beyond those 30, based on AMFI’s location and PIN-code mapping.
B30 should therefore not be treated as a synonym for rural India. It includes every location outside the top 30, including sizable cities.
B30 AUM grew from ₹5.2 lakh crore in March 2021 to ₹13.9 lakh crore in March 2026. T30 AUM rose from ₹26.2 lakh crore to ₹59.8 lakh crore. B30 grew faster, but its share of industry AUM moved only from approximately 16.6% to 18.9%. More than four-fifths of assets remained associated with T30 locations.
Women’s AUM also rose from ₹5.84 lakh crore to ₹15.88 lakh crore. Yet women represented only 26.4% of individual investors in March 2026. The report separately shows that the average folio sizes of women and men were similar by then, suggesting the larger gap was in participation rather than average folio size.
Mutual funds have widened their reach, but income, awareness, access and distribution remain uneven. The industry has travelled further into India. It simply has not travelled everywhere equally.