
Visualizing the evolution of the Indian capital markets
The dramatic transformation of the Indian stock market

Hi, my name is Bhuvan, and welcome to the first edition of Points & Figures.
This is a rebranding of a newsletter we used to publish under The Chatter. In its new avatar, the idea is simple: to tell stories about the Indian economy, financial markets, and investing through data visualizations.
This has been a long-pending idea. We simply couldn’t do it earlier because the team that runs all the initiatives under Markets is barely six or seven people. Considering that we already do more than many much larger publishing teams, the idea of telling stories through data visualizations remained just that—an idea.
But thanks to the affordances offered by tools like Claude and ChatGPT, our small, close-knit team is able to do more than ever before. And that’s the reason you’re reading this edition.
The goal of this publication isn’t to send you a bunch of random, out-of-context charts—although we might occasionally do that. Pretty much everybody does that already, and there’s little value in us doing the same thing.
Instead, our aim is to take large datasets that are often overlooked or underappreciated and use them to tell stories about important aspects of the Indian economy and financial markets. In the editions to come, you’ll see data-driven stories about trends, shifts, and developments that you might not otherwise come across.
And like everything else we do under Markets, the quality bar will remain extremely high.
For our first edition, we thought we’d dive into the Draft Red Herring Prospectus (DRHP) filed by the National Stock Exchange for its IPO and pick out some of the most interesting data points that help explain how Indian capital markets have evolved.
The NSE is the dominant exchange for almost every major asset class in India—equities, equity derivatives, debt securities, ETFs, and more. Its DRHP is a goldmine of insights into both the evolution and current state of Indian capital markets.
My young colleagues, Mridula and Kulsum, went through the 600-page document and picked out the most interesting observations, so you don’t have to.
With that said, here’s our first data story on how Indian capital markets have evolved.
Points & Figures is still in its infancy. While we have a reasonably clear idea of what we want it to become, we’re still figuring out many things along the way. So, as always, we’d love to hear what you think. Read it, send us your feedback, suggestions, and criticism, and we’ll keep making it better.
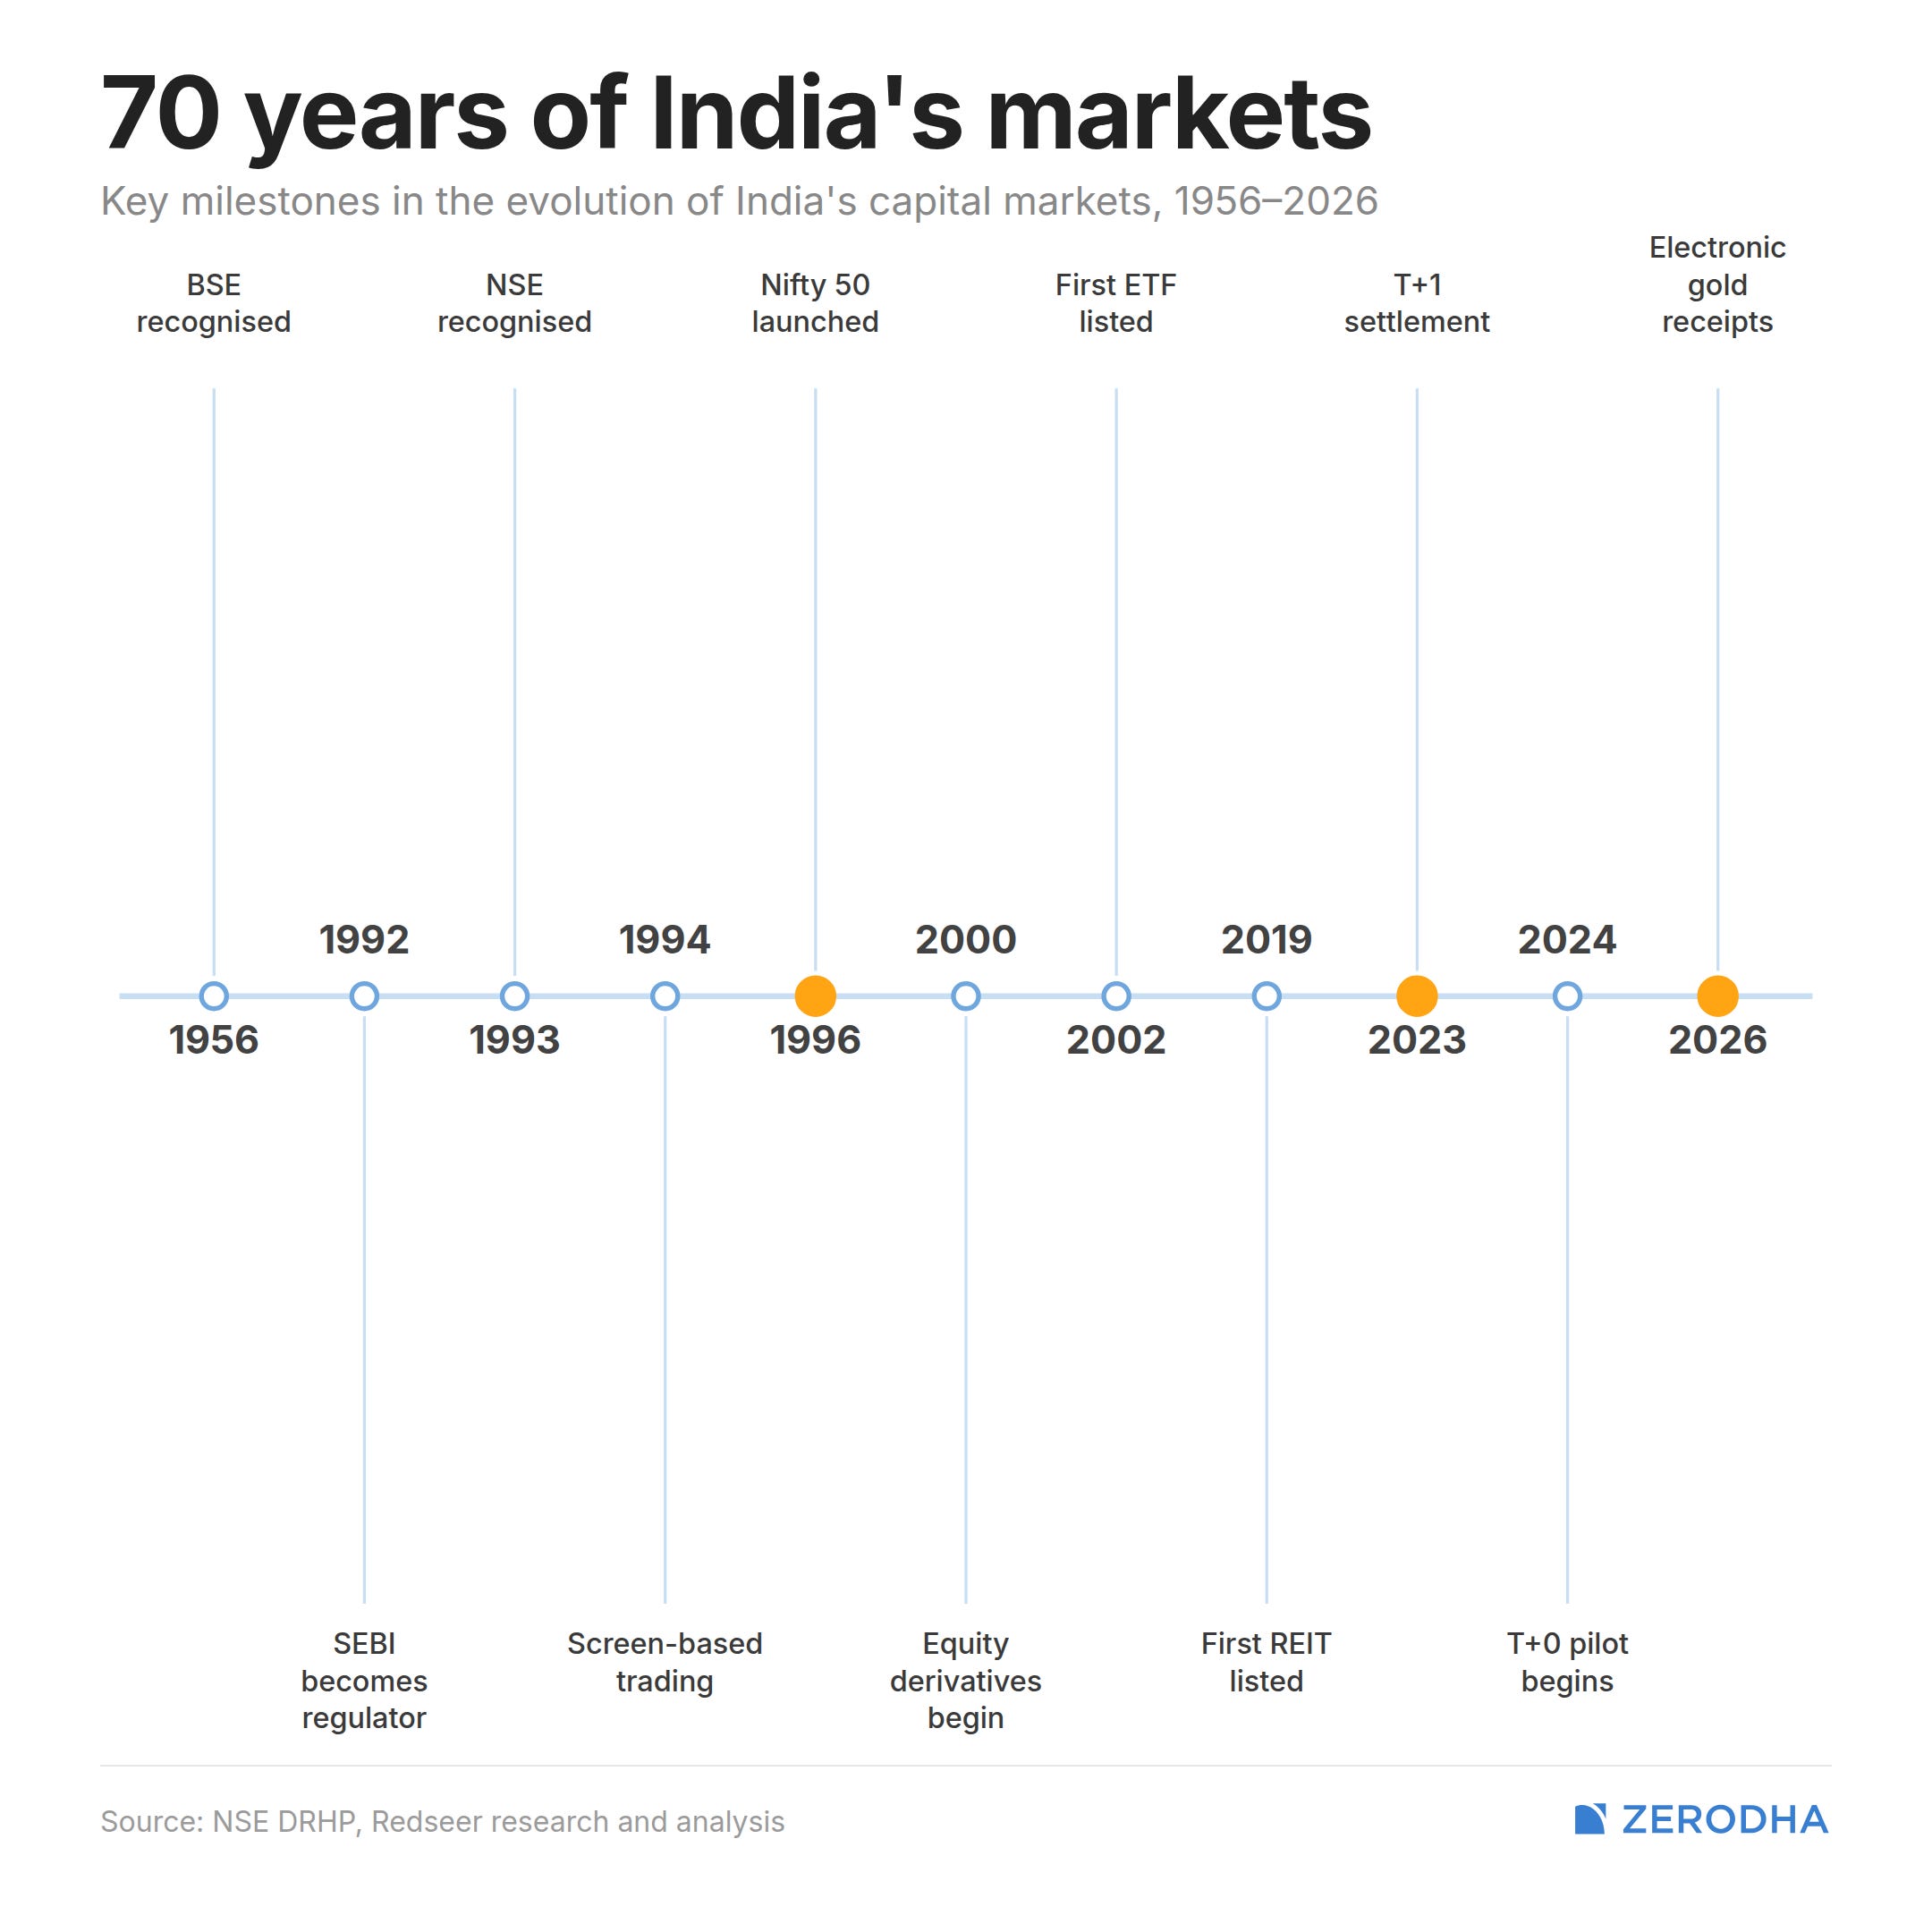
History of Indian stock market
A quick history of the Indian capiral markets.
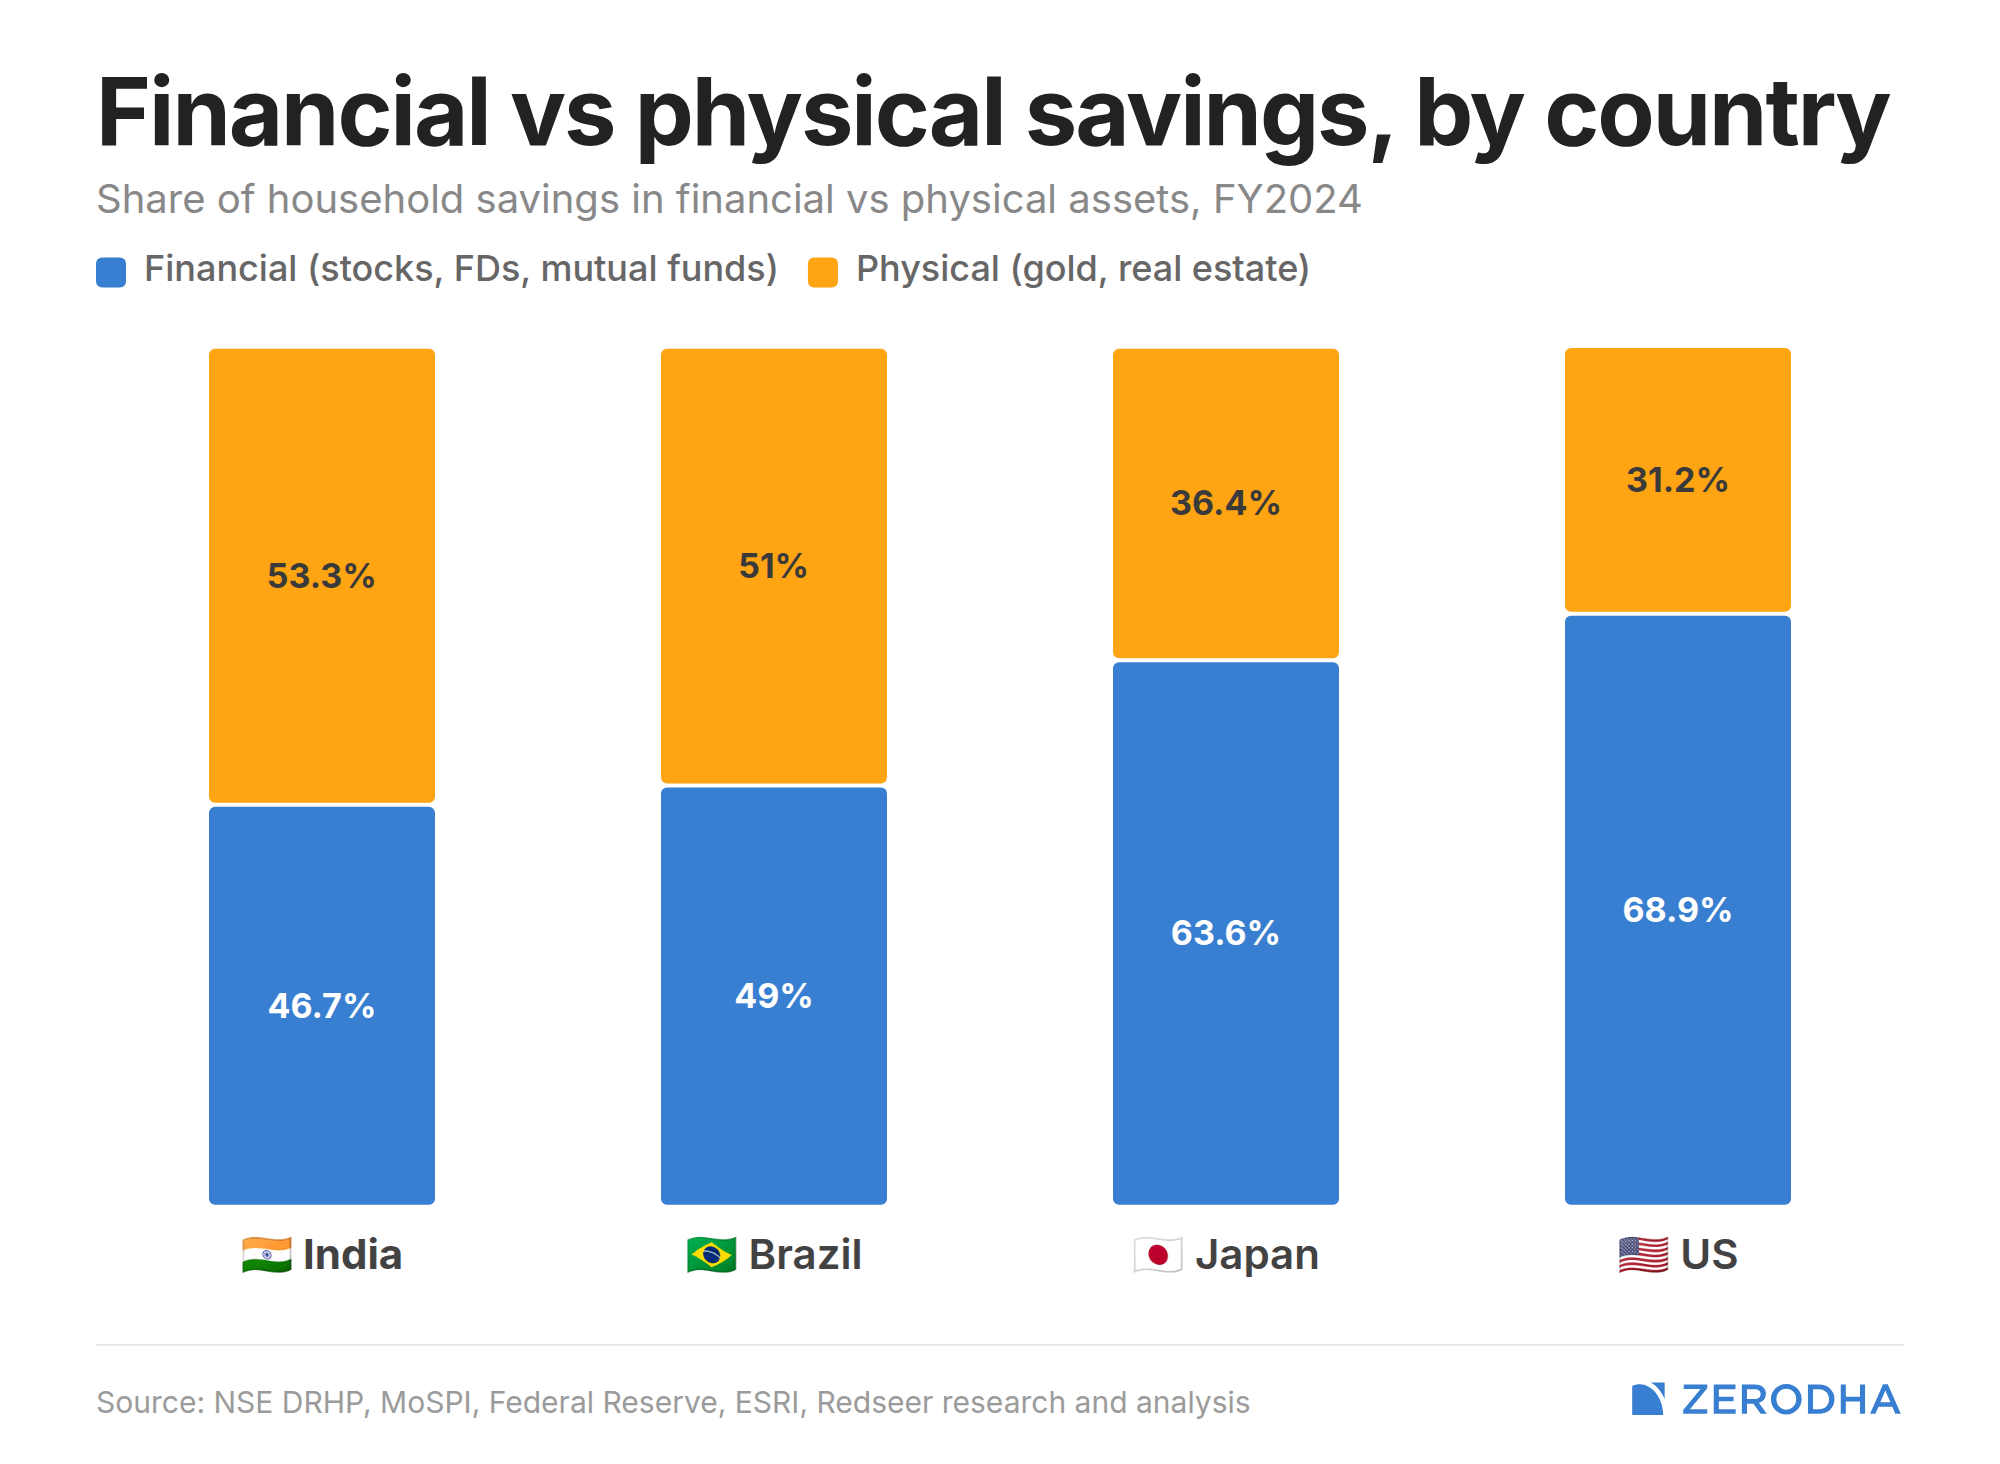
How India invests
Although this chart shows that close to 50% of Indian household assets are held in financial assets, investments in equities and mutual funds still account for only a small share of that. The bulk of household financial savings continues to be allocated to insurance policies, pension funds, bank deposits, and similar instruments.
In that sense, it is still very early days for Indian capital markets when it comes to households investing in direct equities, mutual funds, bonds, and other market-linked products. That said, there has been a clear shift in attitudes toward investing. The post-COVID period saw a large influx of younger, first-time investors, helped by a spectacular bull market and, inevitably, the lure of quick gains.
While much of the post-COVID froth and speculative fervor has now left the market, investing has become more mainstream than ever. Mutual funds, in particular, have emerged as the go-to instrument for Indians seeking exposure to financial markets, whether through equities, gold, debt, or other asset classes.
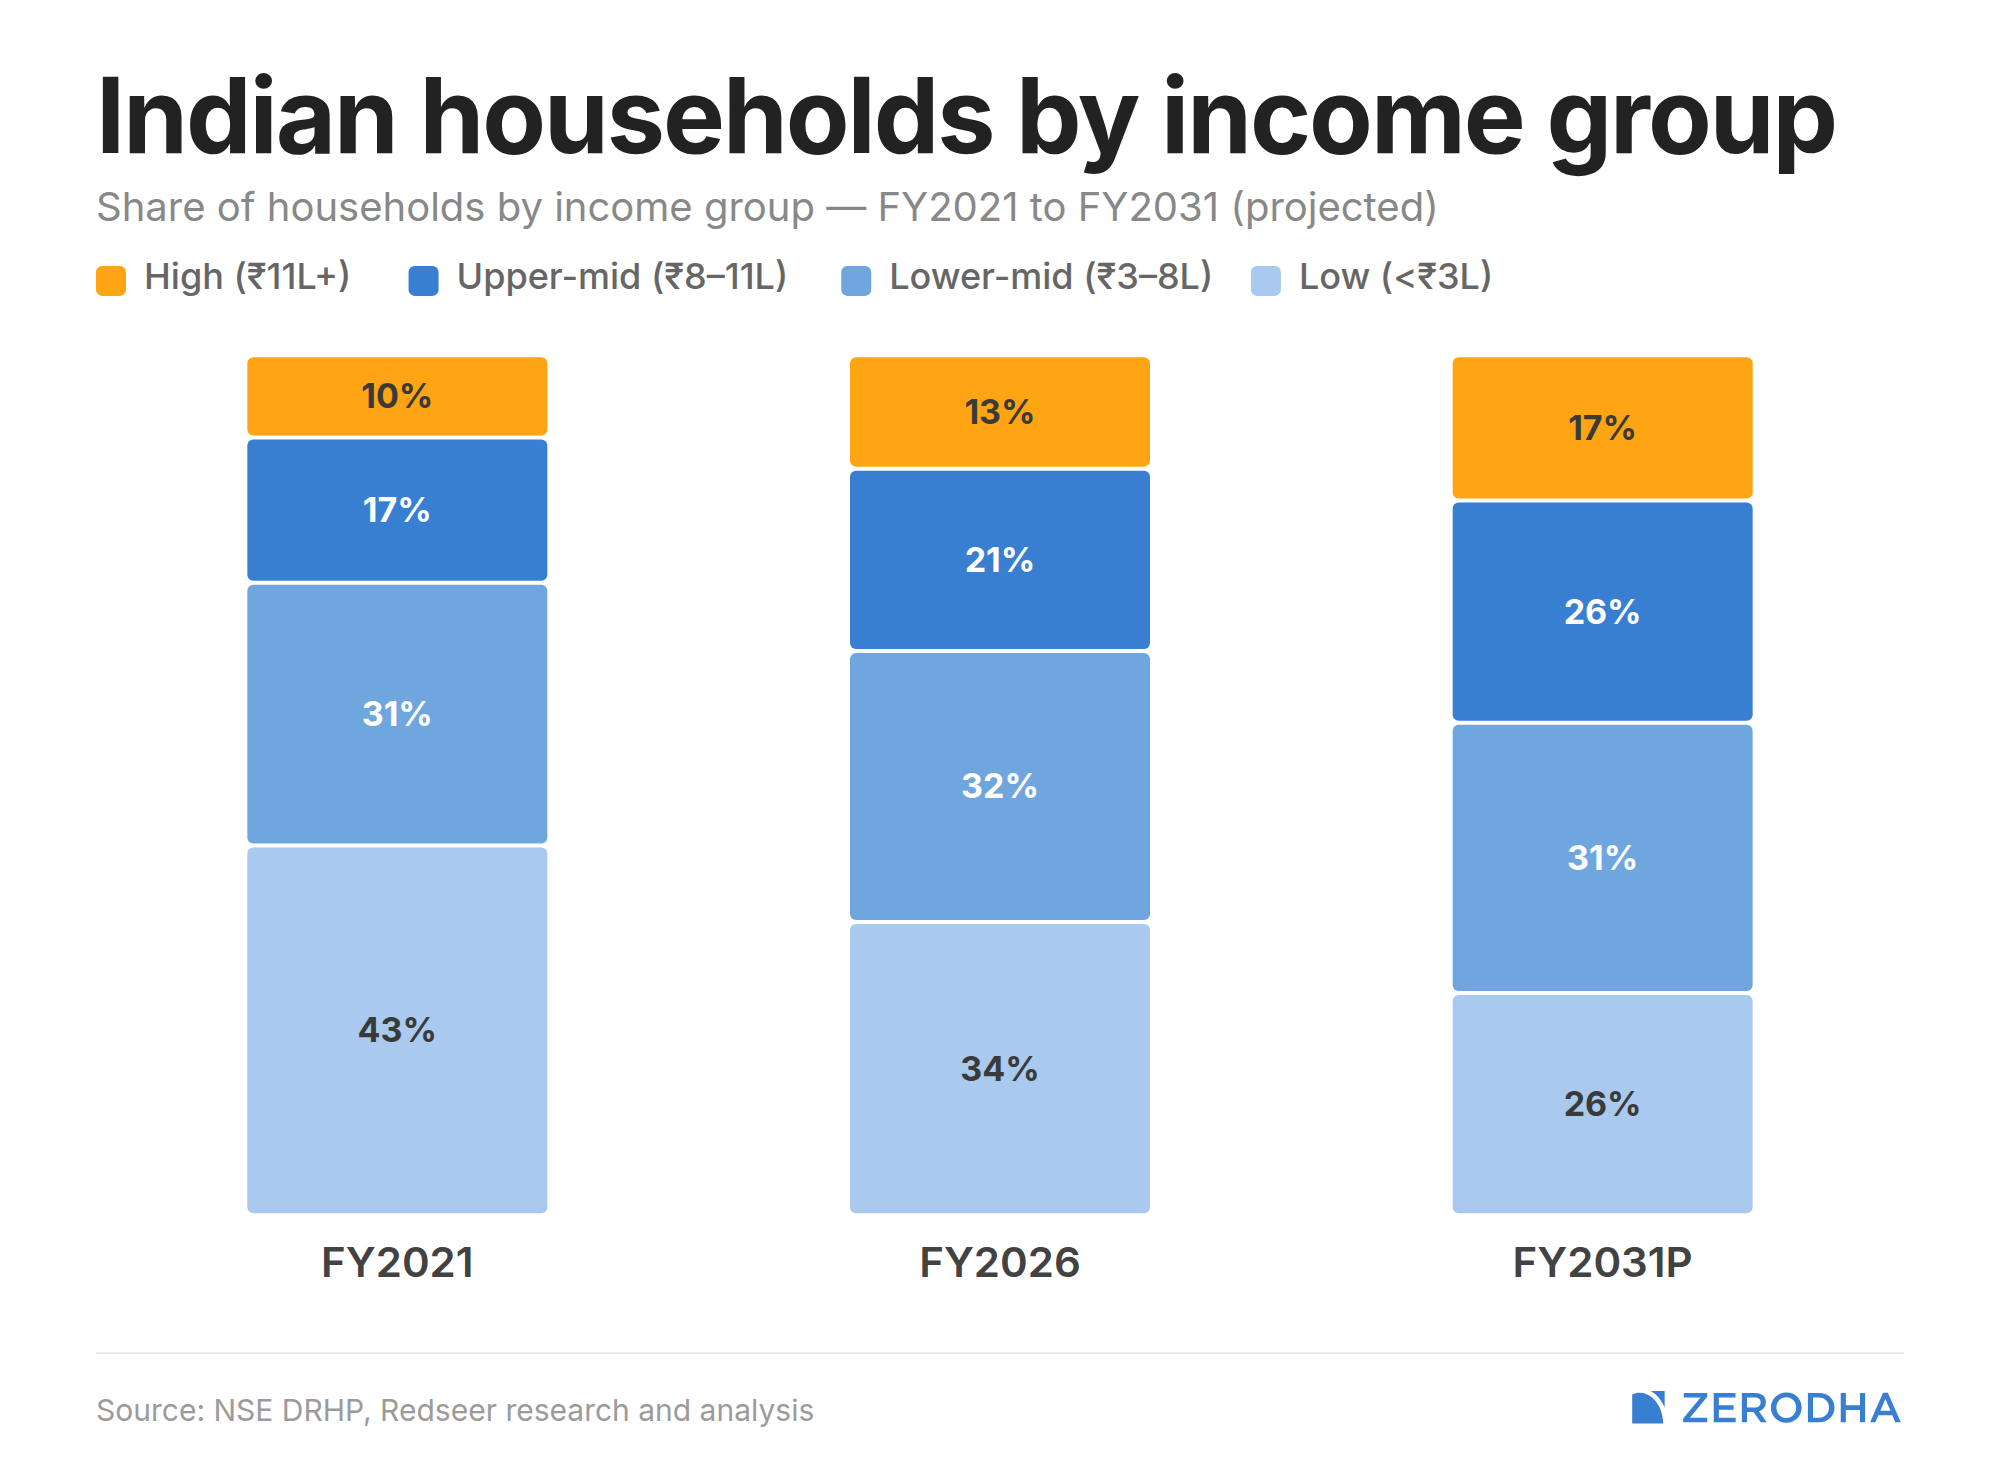
It’s important to remember that India is still a relatively poor country. A large number of Indians still do not have enough surplus income to save and invest meaningfully. In that sense, the growth of Indian capital markets is ultimately a bet on rising incomes and increasing prosperity.
The opportunity ahead remains enormous precisely because so many Indians are yet to become participants in formal financial markets. As incomes rise, savings increase, and more households move beyond meeting their immediate needs, a larger share of those savings is likely to find its way into financial assets.
That doesn’t mean the path ahead will be smooth. India still has its work cut out for it. The geopolitical environment is arguably more uncertain than it has been in decades. Technological shifts, particularly those driven by AI, could reshape industries, jobs, and economic structures in ways that are difficult to predict. And there are plenty of domestic challenges that remain unresolved.
But there is also reason for optimism.
When you step back and look at how far India has come over the last few decades—in terms of incomes, financial inclusion, digital infrastructure, access to markets, and economic opportunity—the progress has been remarkable.
Ultimately, the long-term growth of Indian capital markets is inseparable from the long-term growth of India itself. If India becomes richer, more productive, and more prosperous, that prosperity will inevitably flow through to its capital markets, financial institutions, and the broader financial ecosystem.
Total unique investors
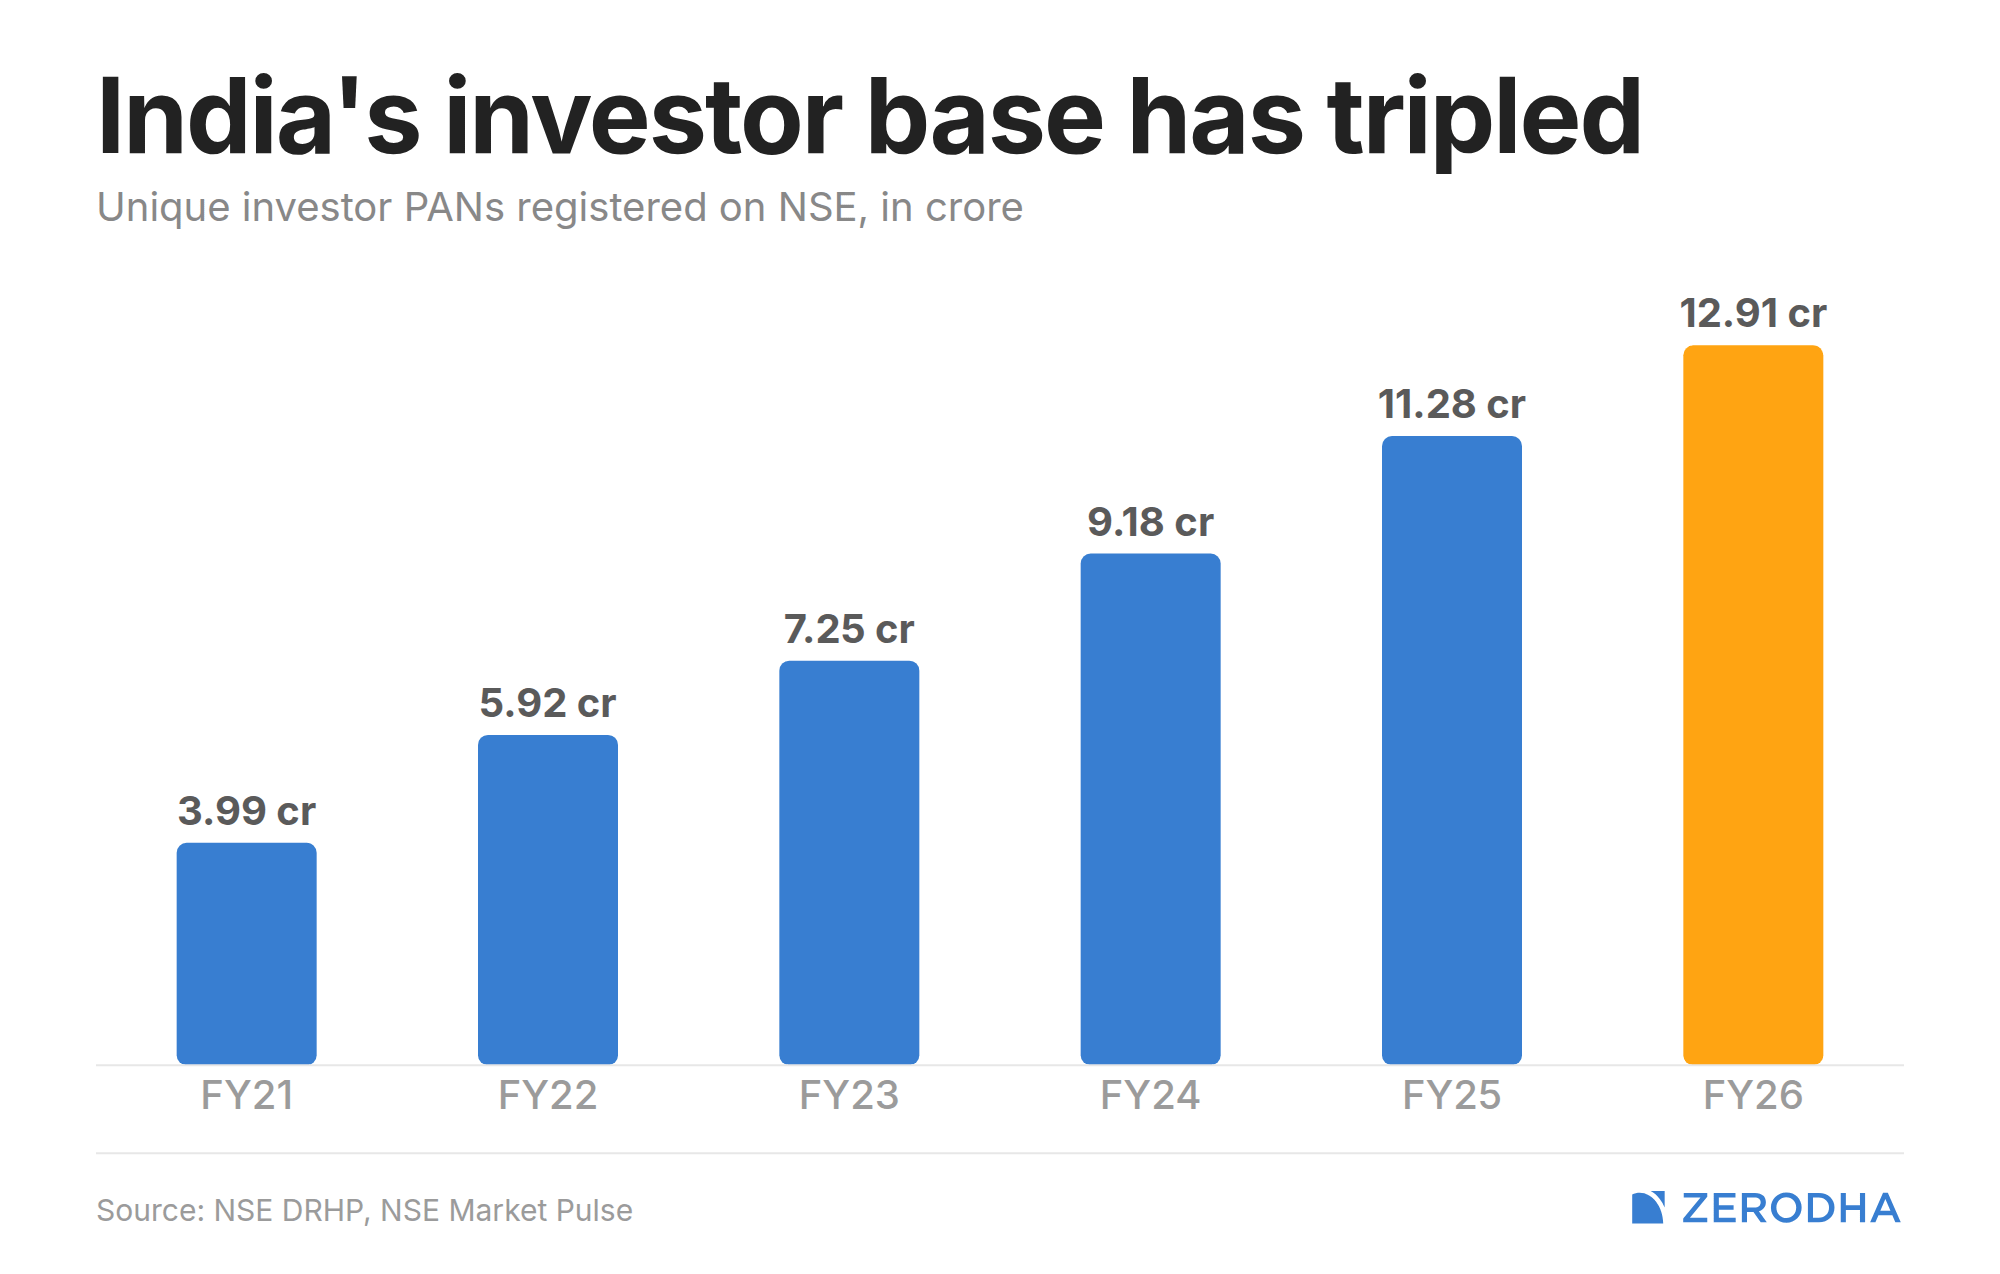
Although you’ll see plenty of data points about how large Indian capital markets are—turnover figures, the number of derivatives contracts traded, mutual fund AUM, cash market volumes, and so on—ultimately, the single most important metric is much simpler: the number of unique investors participating in the markets.
By that measure, India today has nearly 13 crore unique investors, with “unique” defined as unique PAN holders. Interestingly, this is a relatively new data point. NSE only started disclosing it in recent years, and until around 2021–22, we didn’t really have a clear picture of the true size of India’s investor base.
What’s remarkable is how quickly this number has grown. Prior to COVID, the unique investor base was only around 1–1.5 crore. In the span of roughly six years, that number has grown to nearly 13 crore.
Here’s a fun fact: in the last six years alone, India has added more investors than it did in the entire history of its capital markets from the 1950s up until COVID.
To my mind, the history of Indian capital markets is now divided into two distinct eras: the period before COVID and the period after COVID. The first runs roughly from the 1960s to 2020. The second begins in 2020 and continues today.
In just a few years, an extraordinary amount of change has been compressed into the system. The scale and speed of the transformation—in participation, awareness, accessibility, and adoption—are such that I still find it difficult to fully wrap my head around how much has changed in such a short span of time.
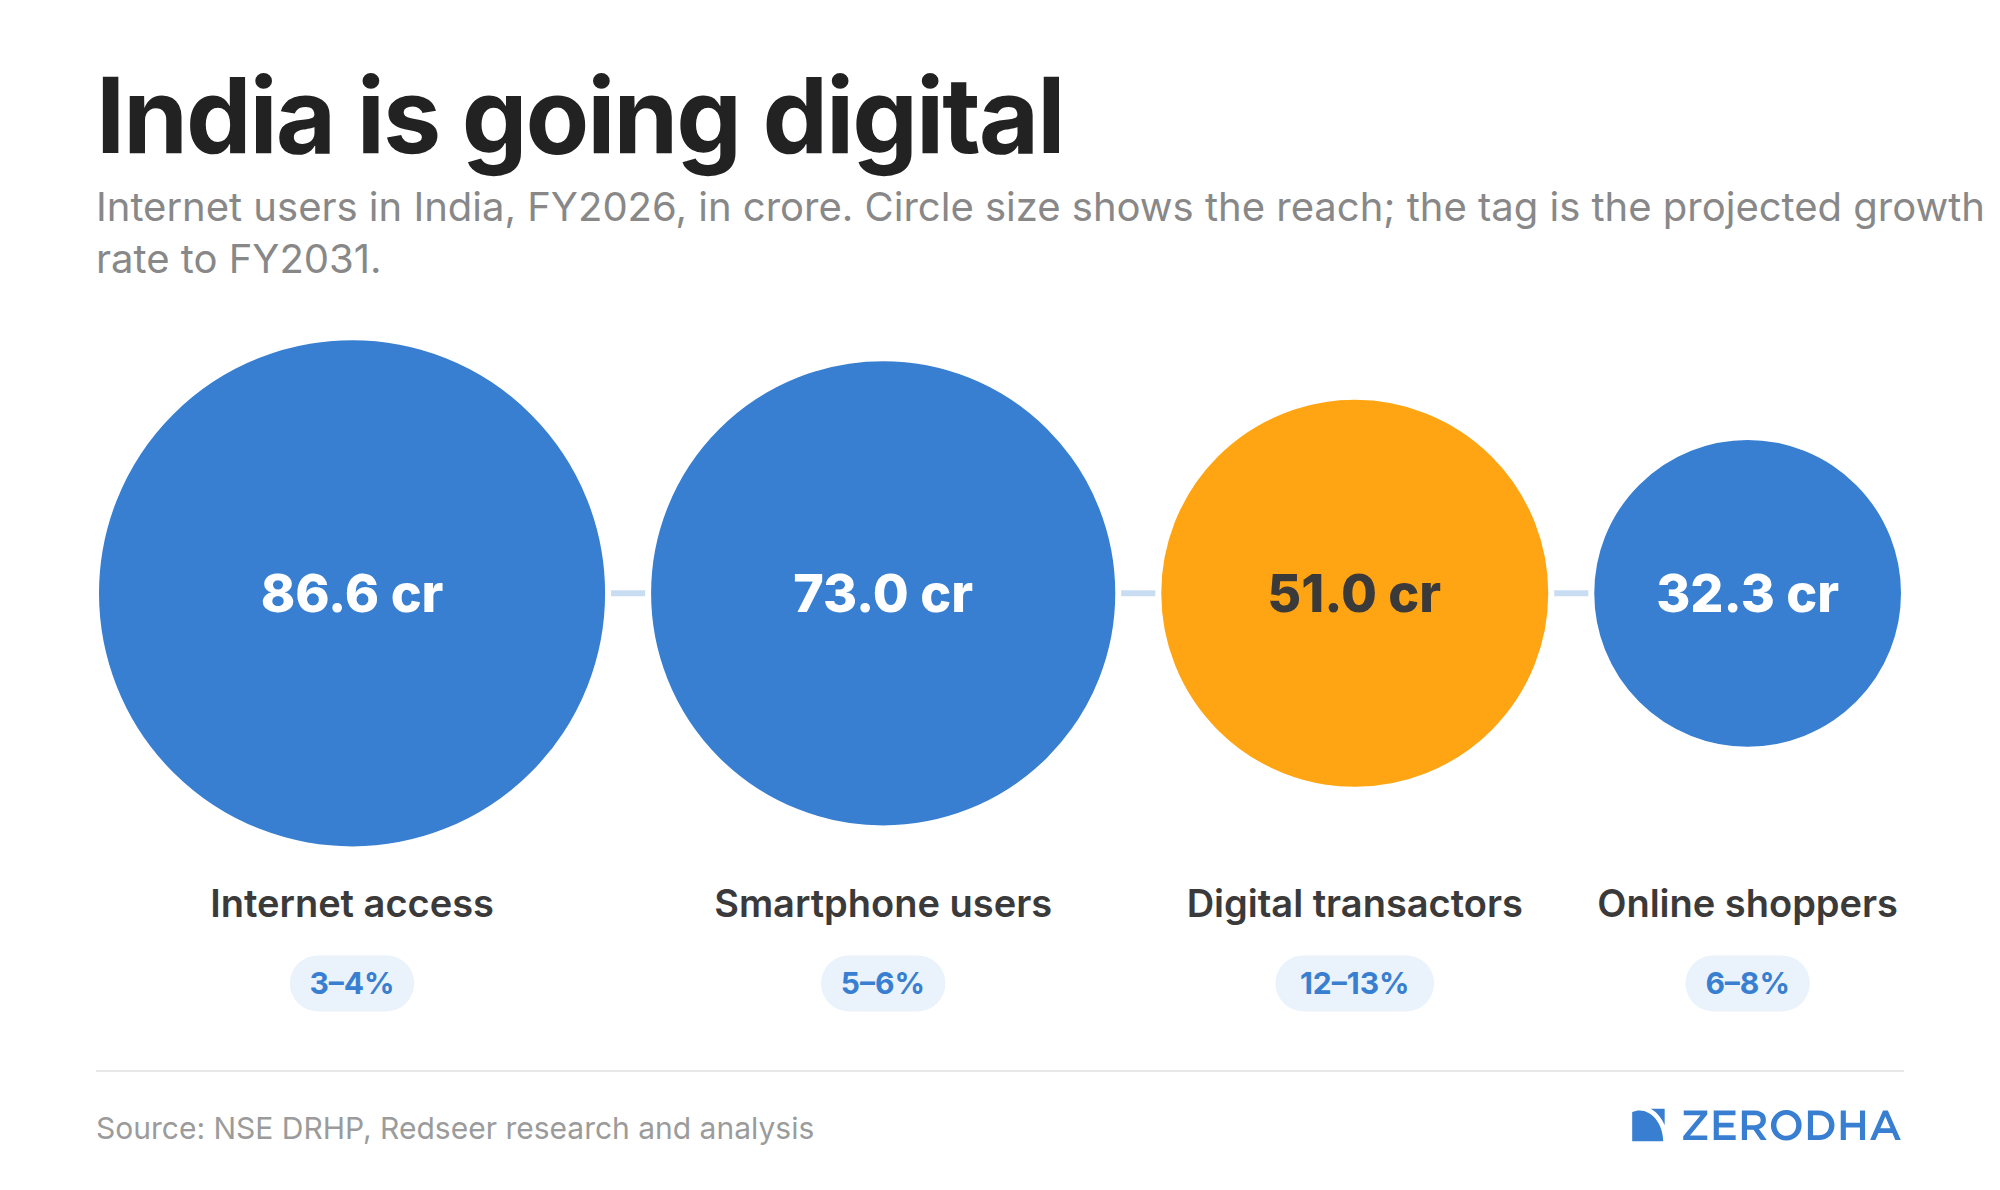
The spectacular growth of Indian capital markets after COVID wasn’t driven solely by rising interest in investing. Equally important was the fact that, by the time the pandemic arrived, India had already built much of the digital infrastructure required to support mass participation in financial markets.
Opening a broking account, investing in mutual funds, completing KYC requirements, signing documents, and verifying identity could all be done entirely online, thanks to the combination of Aadhaar, e-signatures, and DigiLocker. Payments had become seamless through UPI. Mobile internet was affordable and widely accessible thanks in large part to the disruption brought about by Jio. And for the first time in India’s history, hundreds of millions of people had access to the internet through a smartphone in their pocket.
In hindsight, this digital infrastructure was one of the most important enablers of the post-COVID investing boom.
Had the pandemic occurred a decade earlier, it is difficult to imagine Indian capital markets witnessing the same scale of participation. The friction involved in opening accounts, transferring money, completing paperwork, and accessing market information would have been far higher.
Instead, when millions of Indians became curious about investing during the post-COVID bull market, the infrastructure was already in place. The rails had been built. All people had to do was download an app, complete a few digital verification steps, and start investing.
The rise of Indian capital markets over the last few years is therefore not just a story about markets. It is also a story about India’s digital public infrastructure and how the combination of Aadhaar, DigiLocker, e-signatures, UPI, affordable smartphones, and cheap mobile internet dramatically reduced the barriers to financial participation.
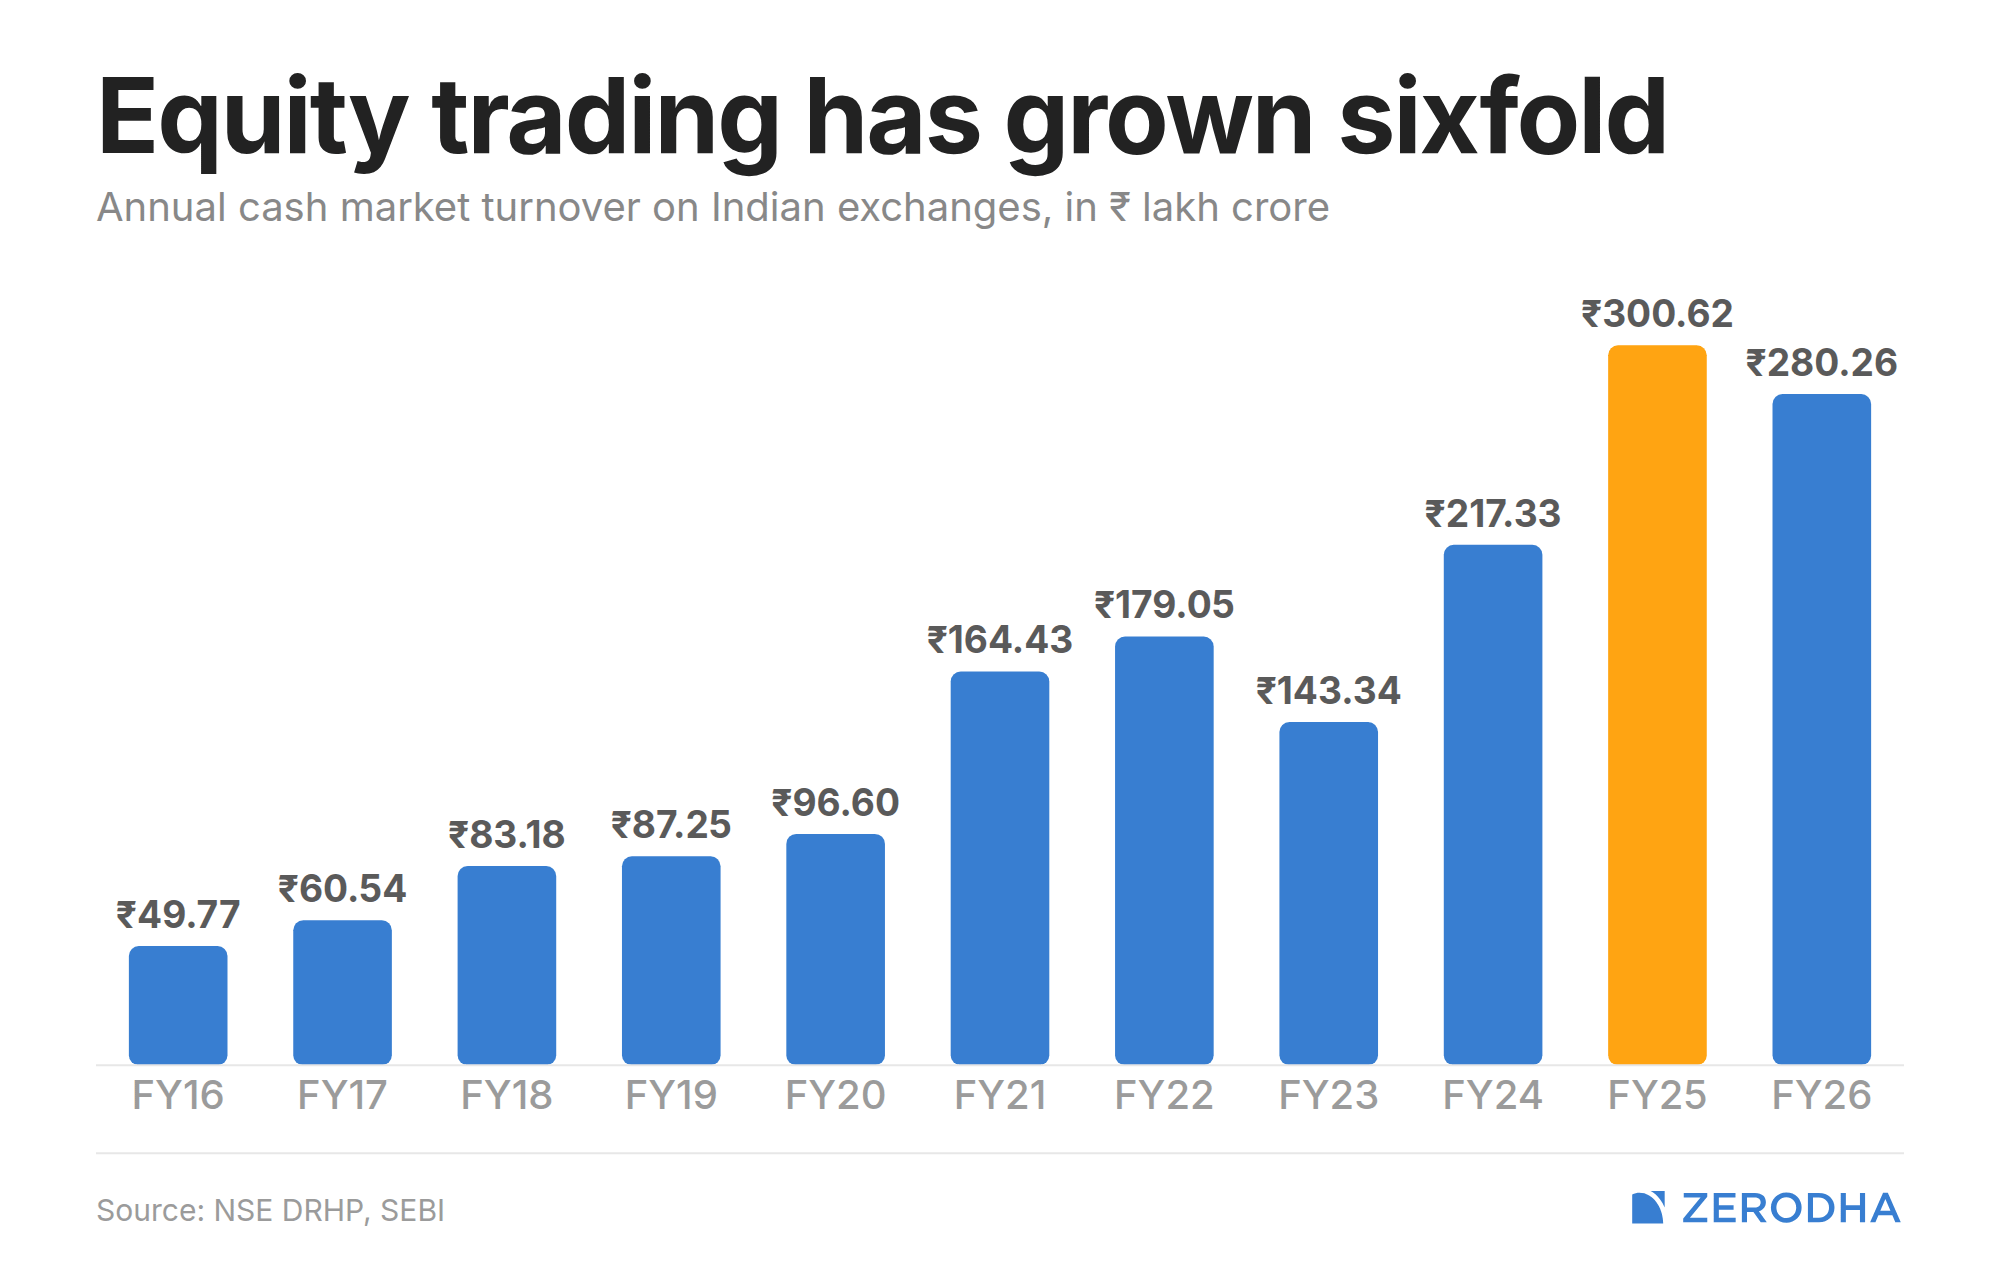
Another illustration of the post-COVID expansion in investor participation is the explosion in cash market activity.
This chart shows the total turnover in the equity cash market. On the eve of COVID, annual turnover stood at roughly ₹100 lakh crore. Since then, it has nearly tripled, reflecting both the sharp increase in the number of market participants and the broader rise in trading activity.
The slight decline at the end of the series is largely a function of market conditions. Indian equities began correcting around September 2024, and cash market turnover has yet to recover to the peaks seen during the post-COVID bull market.
What’s worth noting is that turnover figures tend to fluctuate with market sentiment and activity levels. But even after accounting for the recent slowdown, the scale of participation in the cash market today is dramatically higher than it was just a few years ago, underscoring how profoundly Indian capital markets have changed in the post-COVID era.
The relentless growth of mutual funds
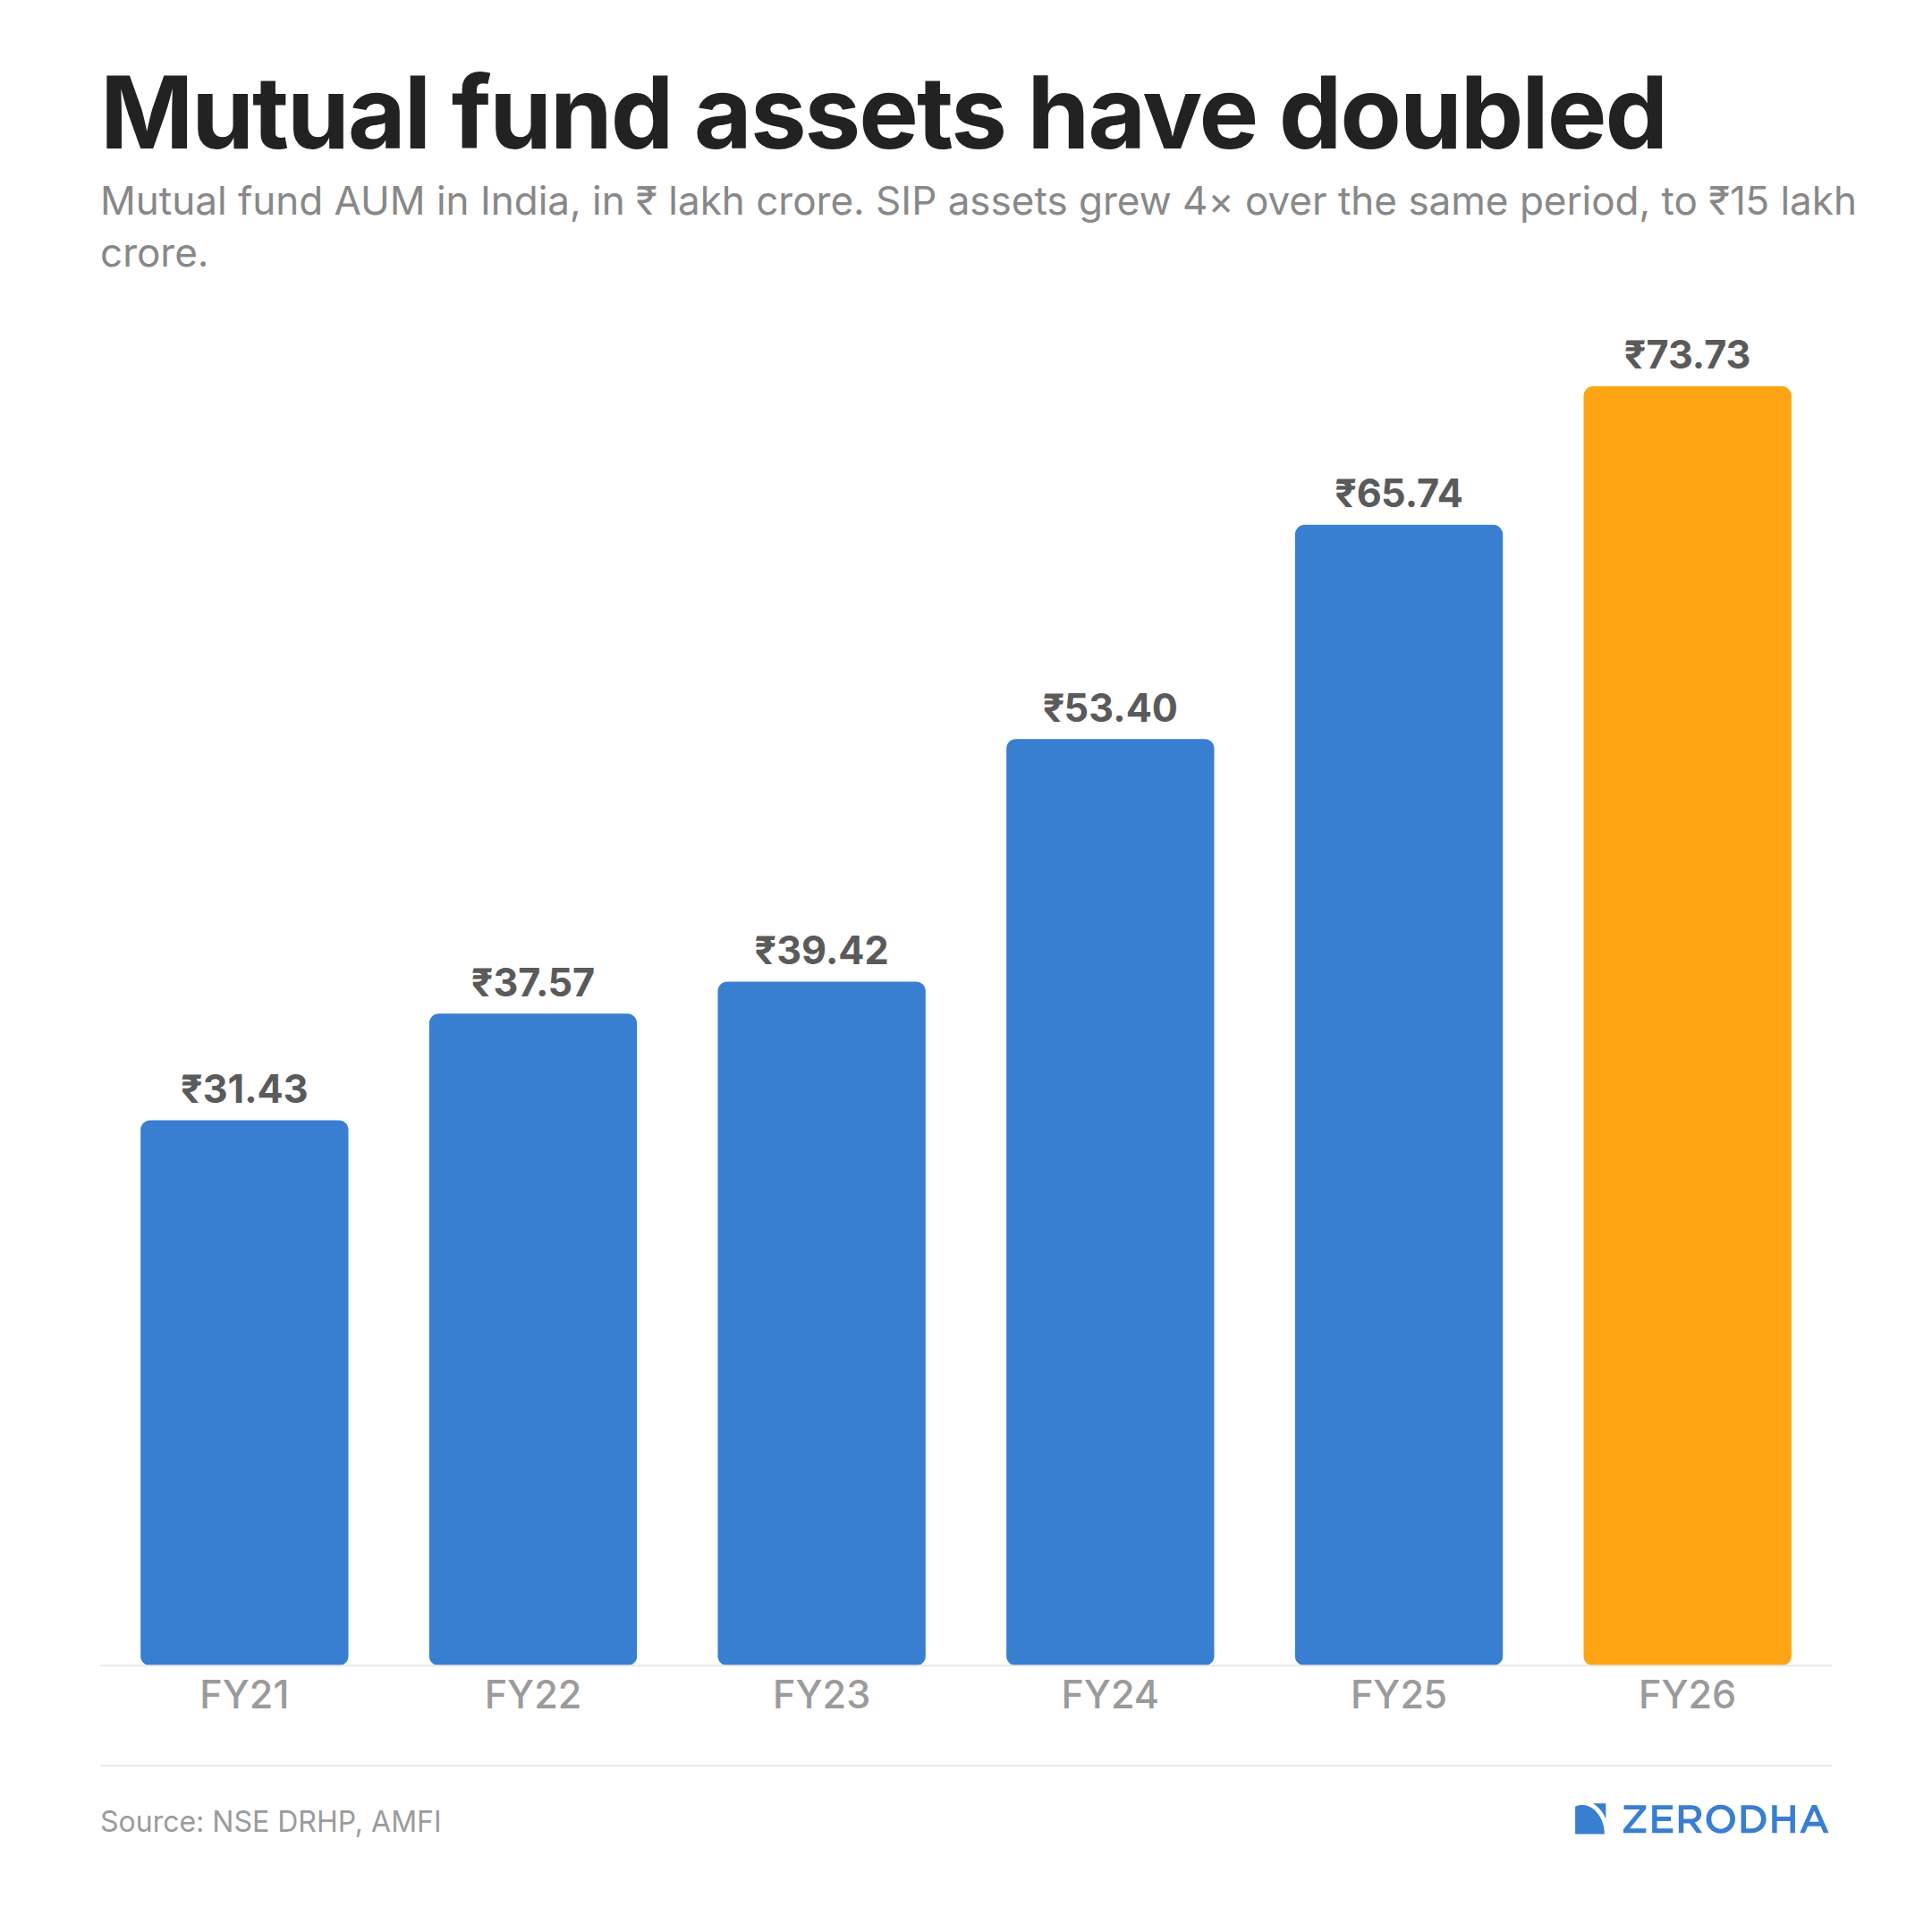
The star of the post-COVID phase of Indian capital markets has undoubtedly been mutual funds.
Mutual funds have become the default way for the average Indian to get exposure to the markets, and we’ve seen a spectacular increase in assets under management over the last few years. What’s particularly interesting is that this growth has been broad-based. It’s not just that more money is flowing into mutual funds; the number of unique investors has increased dramatically as well, and investors are increasingly using a wider variety of products.
The mutual fund industry has also evolved alongside investor demand. Today, investors have access to everything from low-cost index funds to all-in-one asset allocation products like multi-asset funds. More recently, regulators have approved life cycle funds, which are broadly India’s version of target-date funds.
Perhaps the biggest change is just how easy it has become for investors to build diversified portfolios through mutual funds. Today, investors can get exposure to equities, debt, gold, commodities, and even international markets through a single investment platform. International investing has become somewhat more difficult because of the overseas investment limits, but the broader point still stands: mutual funds have made diversification dramatically simpler than it was a decade ago.
For the average salaried investor with some money to save every month, mutual funds have effectively become the default investment vehicle. But it’s not just retail investors. Mutual funds are also widely used by HNIs, family offices, and corporate treasuries, partly because of the convenience and flexibility of the structure and partly because of the tax efficiencies that mutual funds have historically offered relative to many alternatives.
In many ways, if the post-COVID era belongs to any one product category, it belongs to mutual funds.
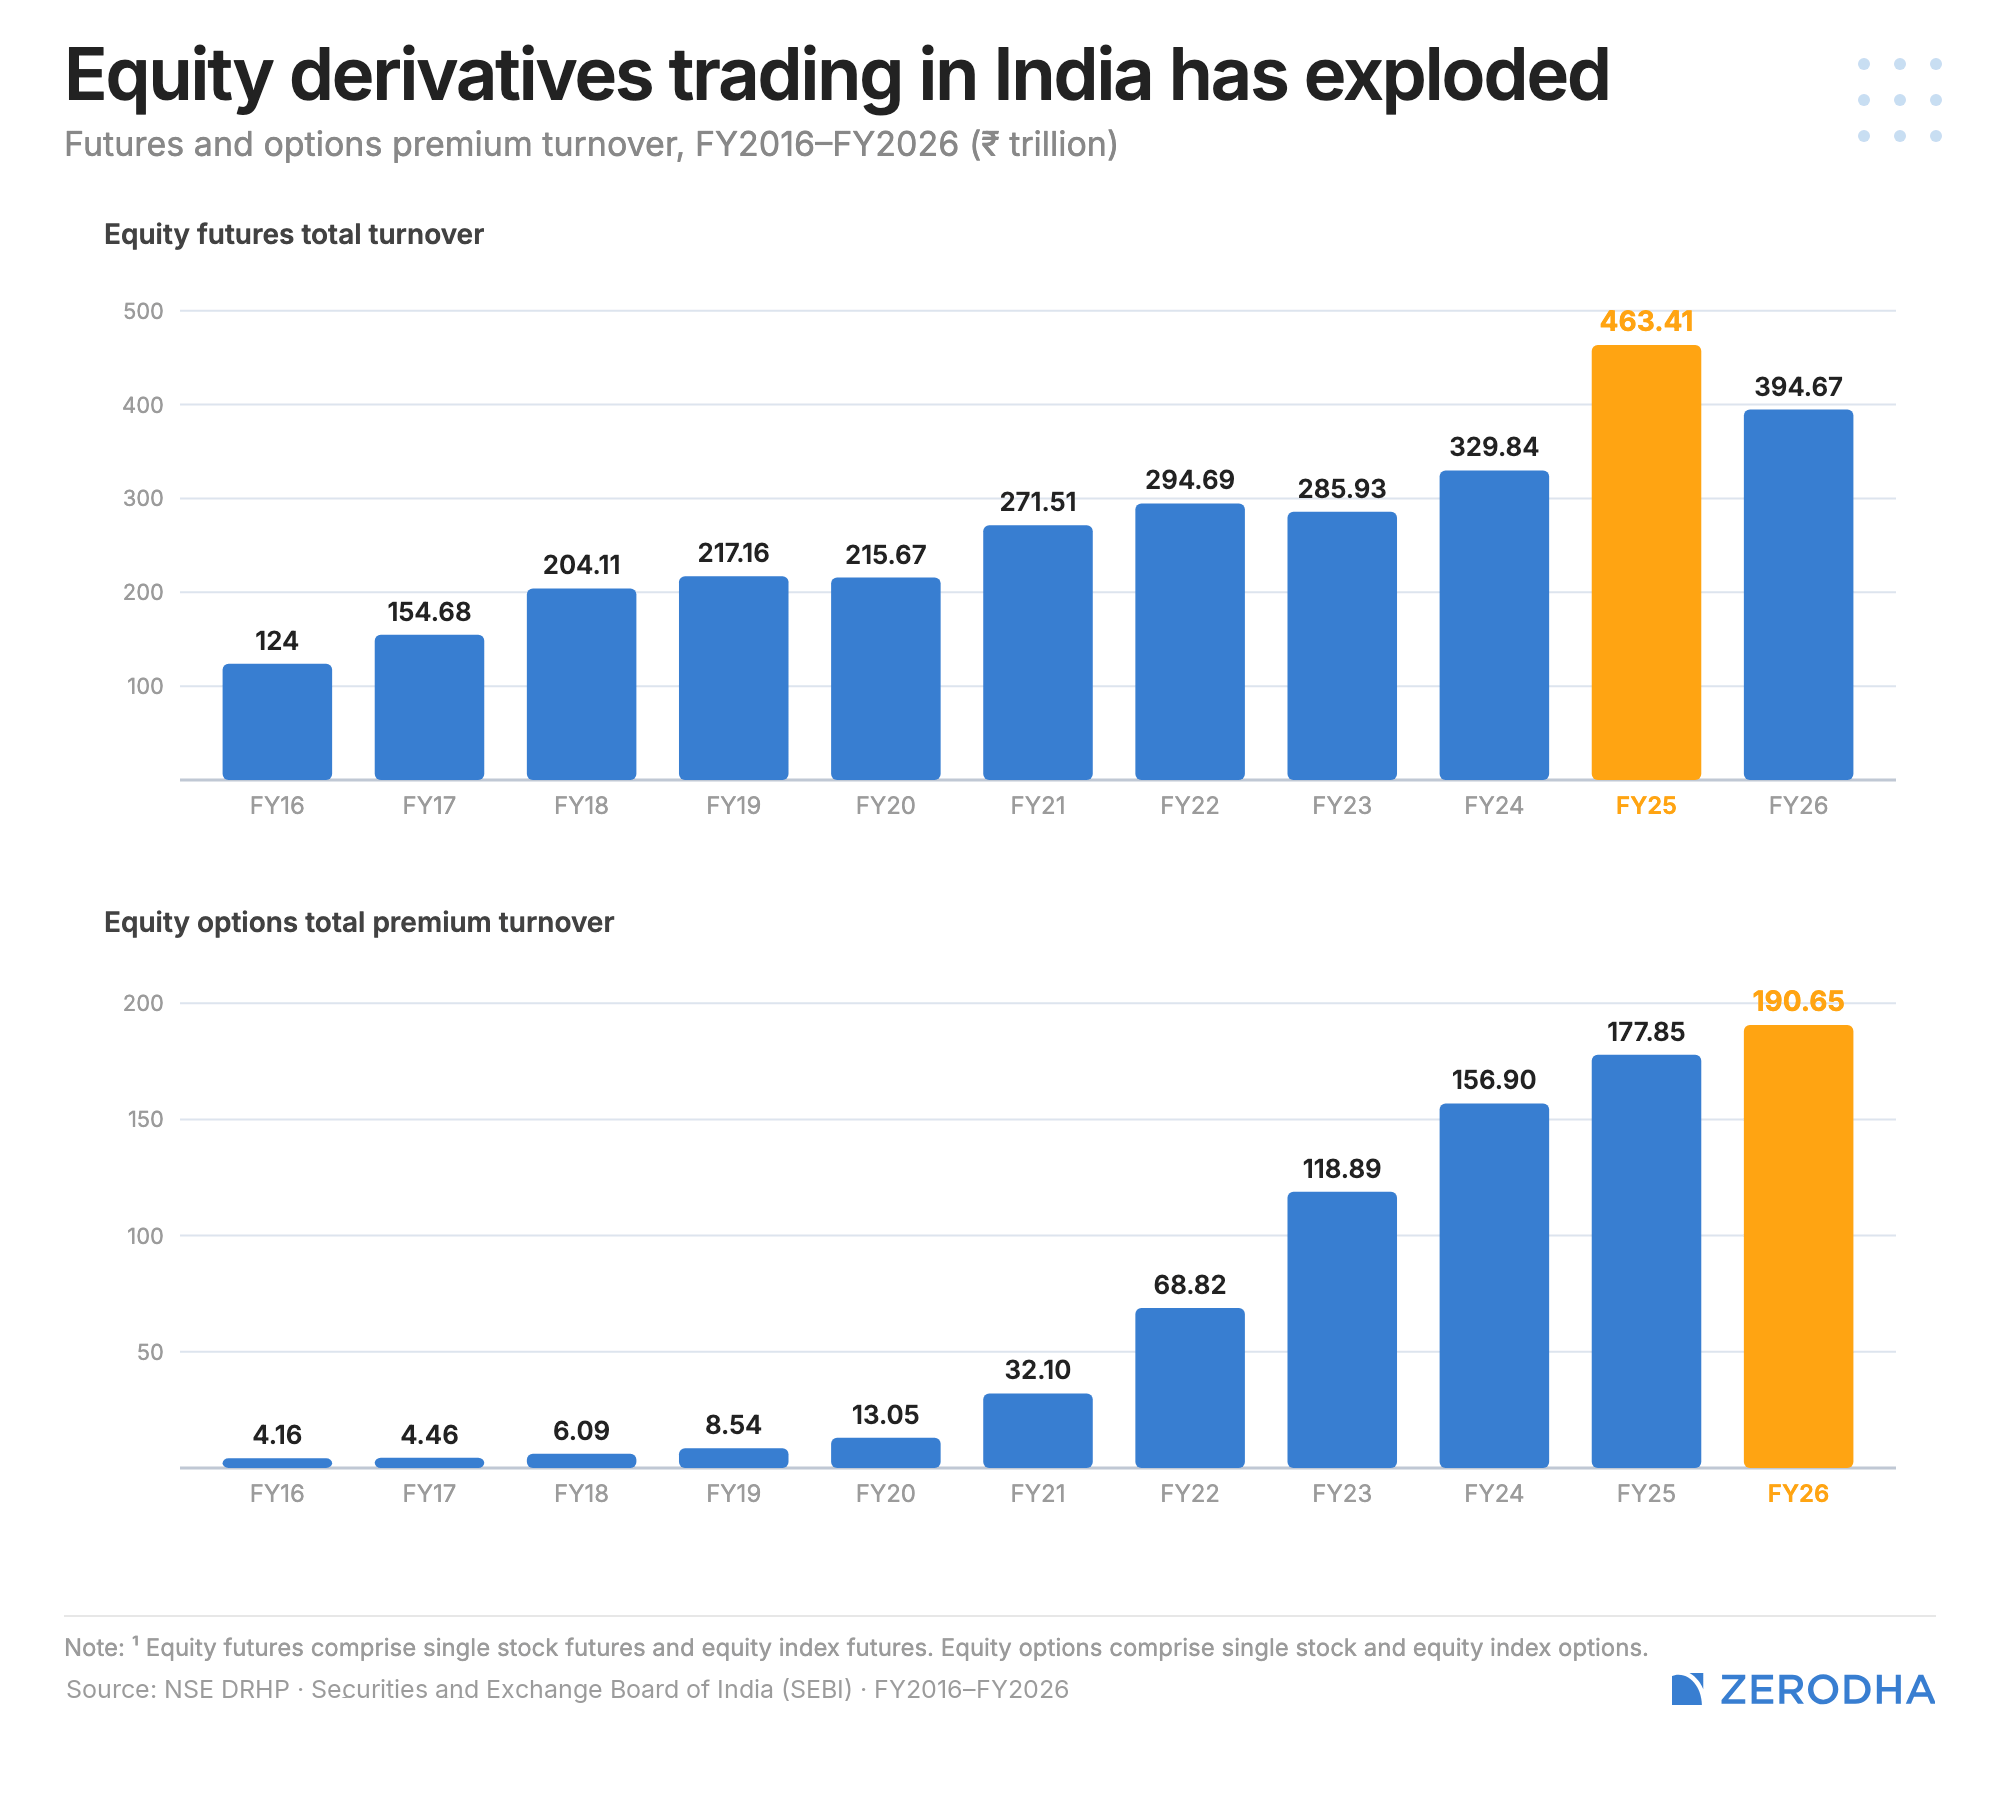
Increase in options volumes
As popular as direct equities and mutual funds have become, the real star of the post-COVID era has been the spectacular rise in options trading activity.
In many ways, this has been the defining trend in Indian capital markets over the last few years, and exchanges, brokers, and other market participants have all been beneficiaries of this surge in activity.
While futures trading has also grown, options have emerged as the preferred instrument for most traders. One reason is cost. Futures have become relatively more expensive to trade because of the impact of the Securities Transaction Tax (STT), whereas options offer a more capital-efficient way to take directional or hedged positions.
As a result, options have become the go-to instrument for retail participation in derivatives markets, especially in the post-COVID period.
That said, activity has moderated from its peak. Trading volumes and turnover have cooled somewhat due to a combination of factors, including tighter regulations around derivatives trading, higher margin requirements, and a broader lull in market sentiment as equities have largely moved sideways. Even so, the scale of options trading today remains far higher than it was before COVID, making it one of the most significant structural shifts in the evolution of Indian capital markets.
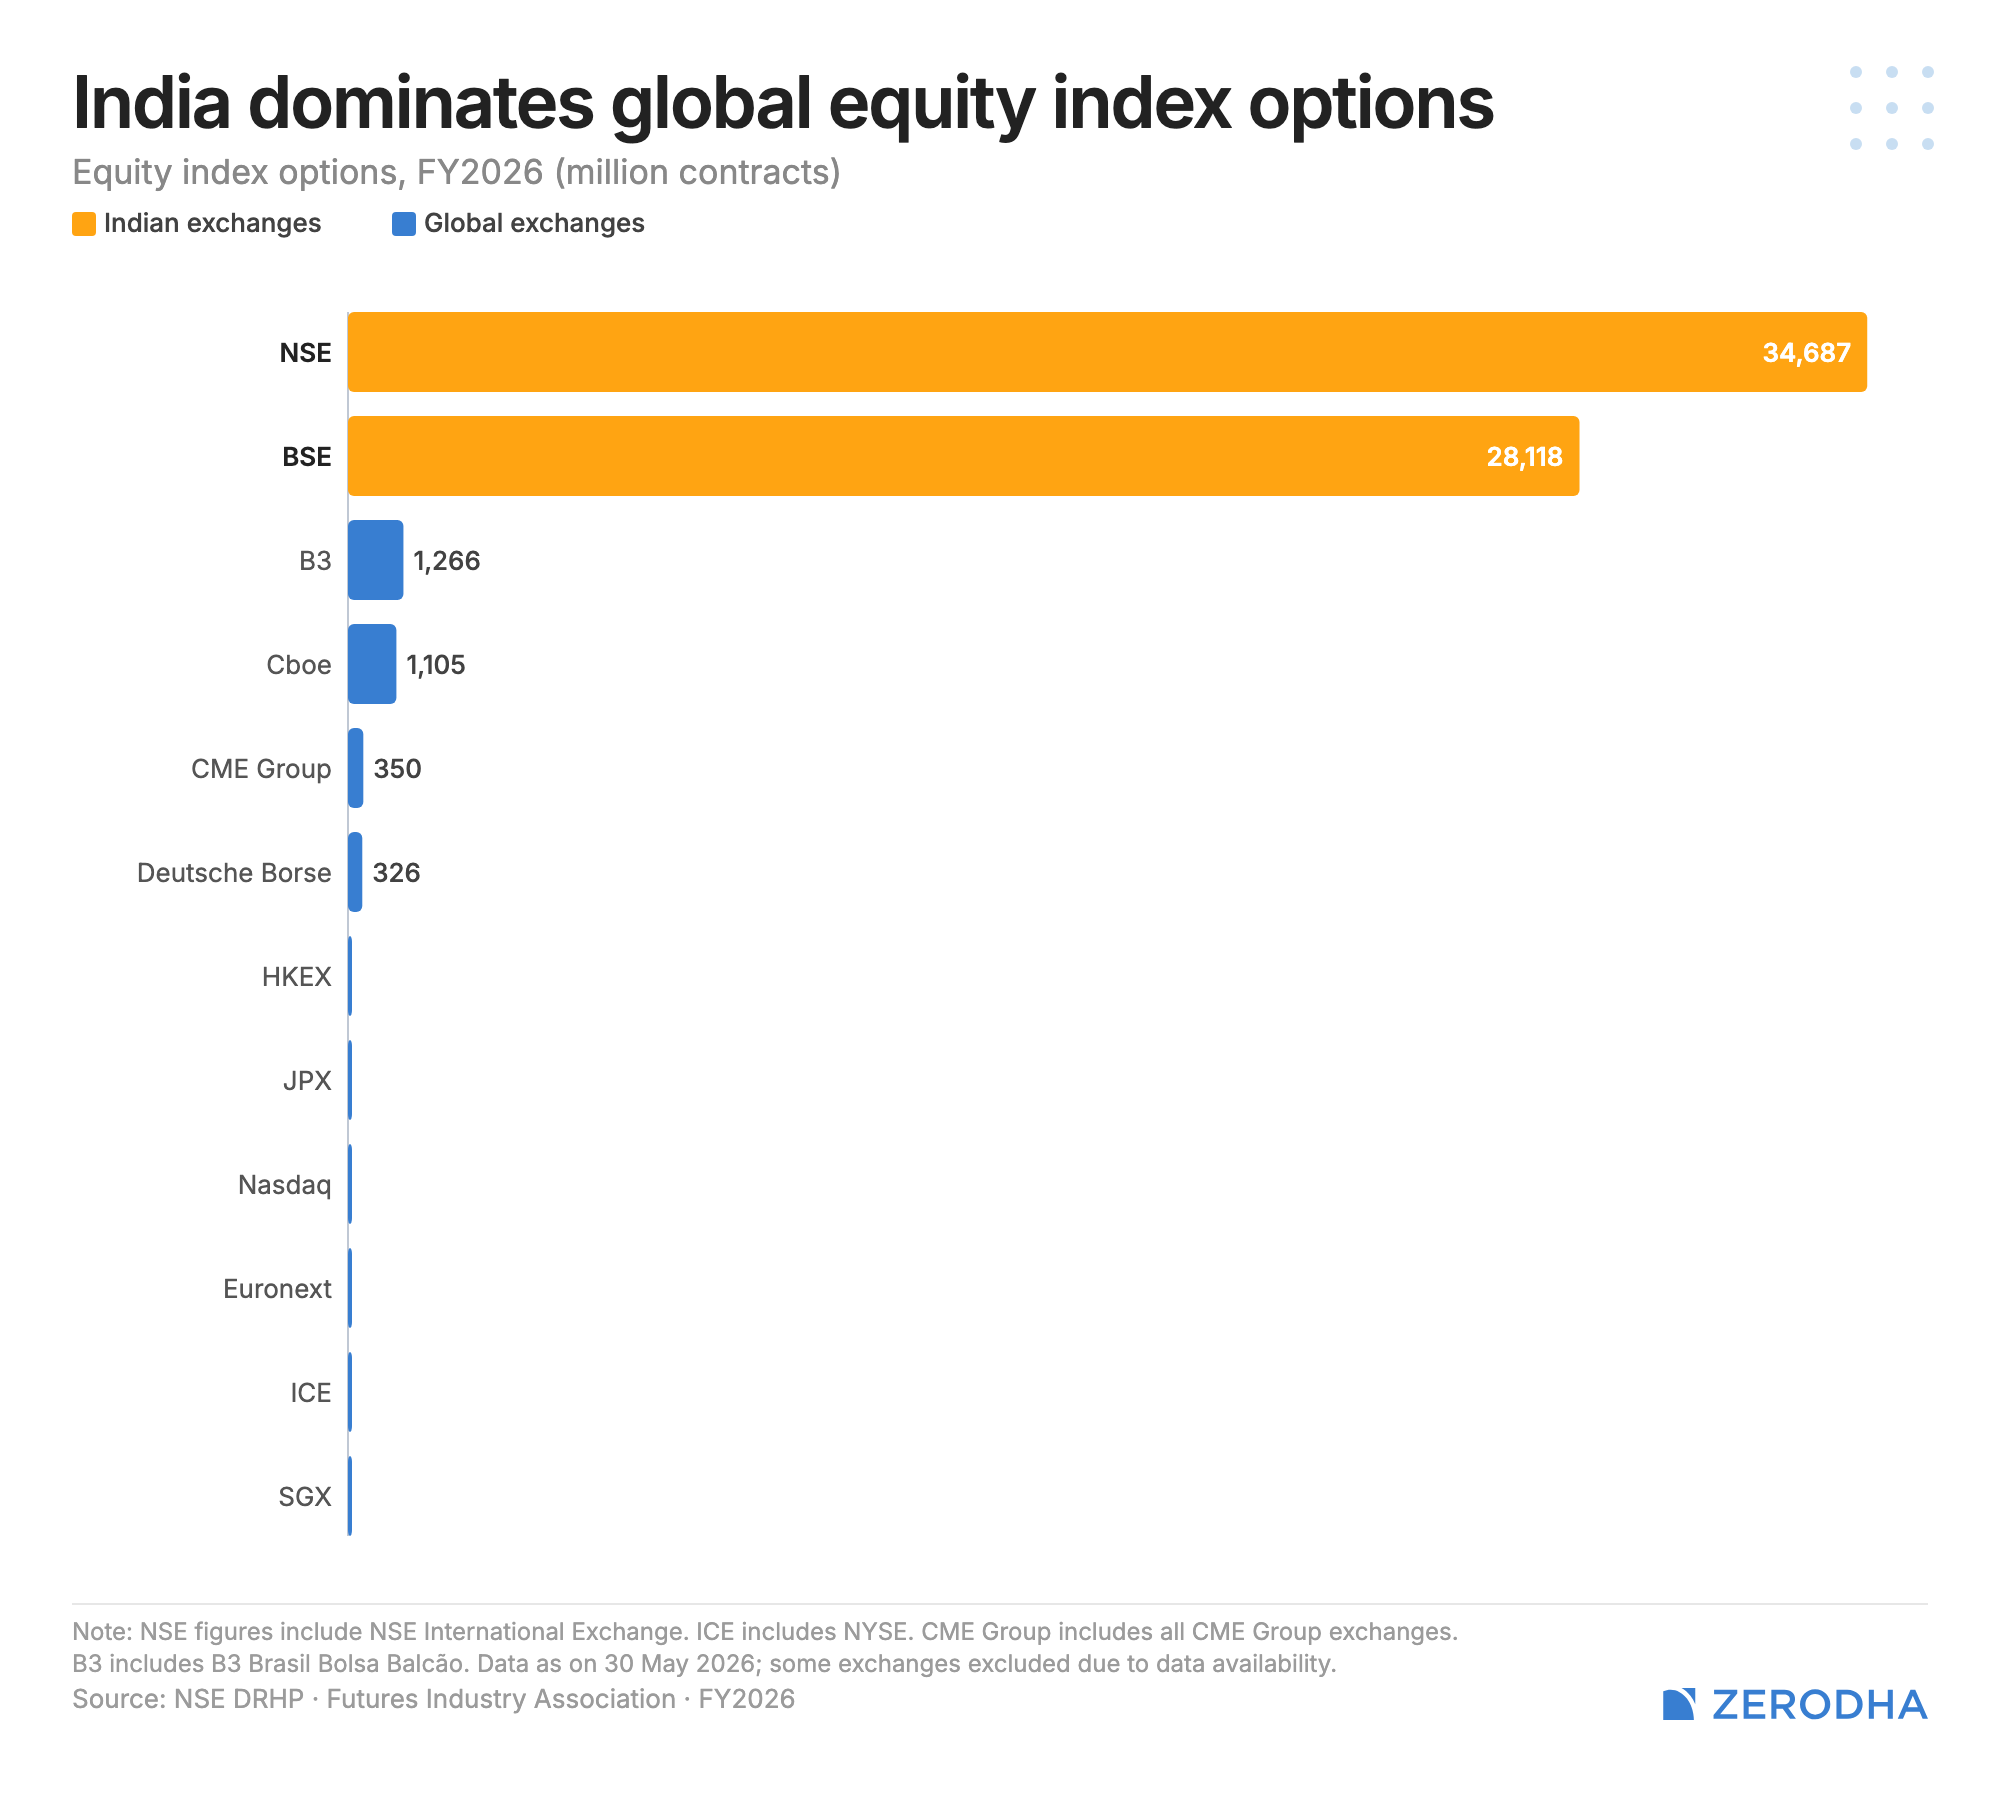
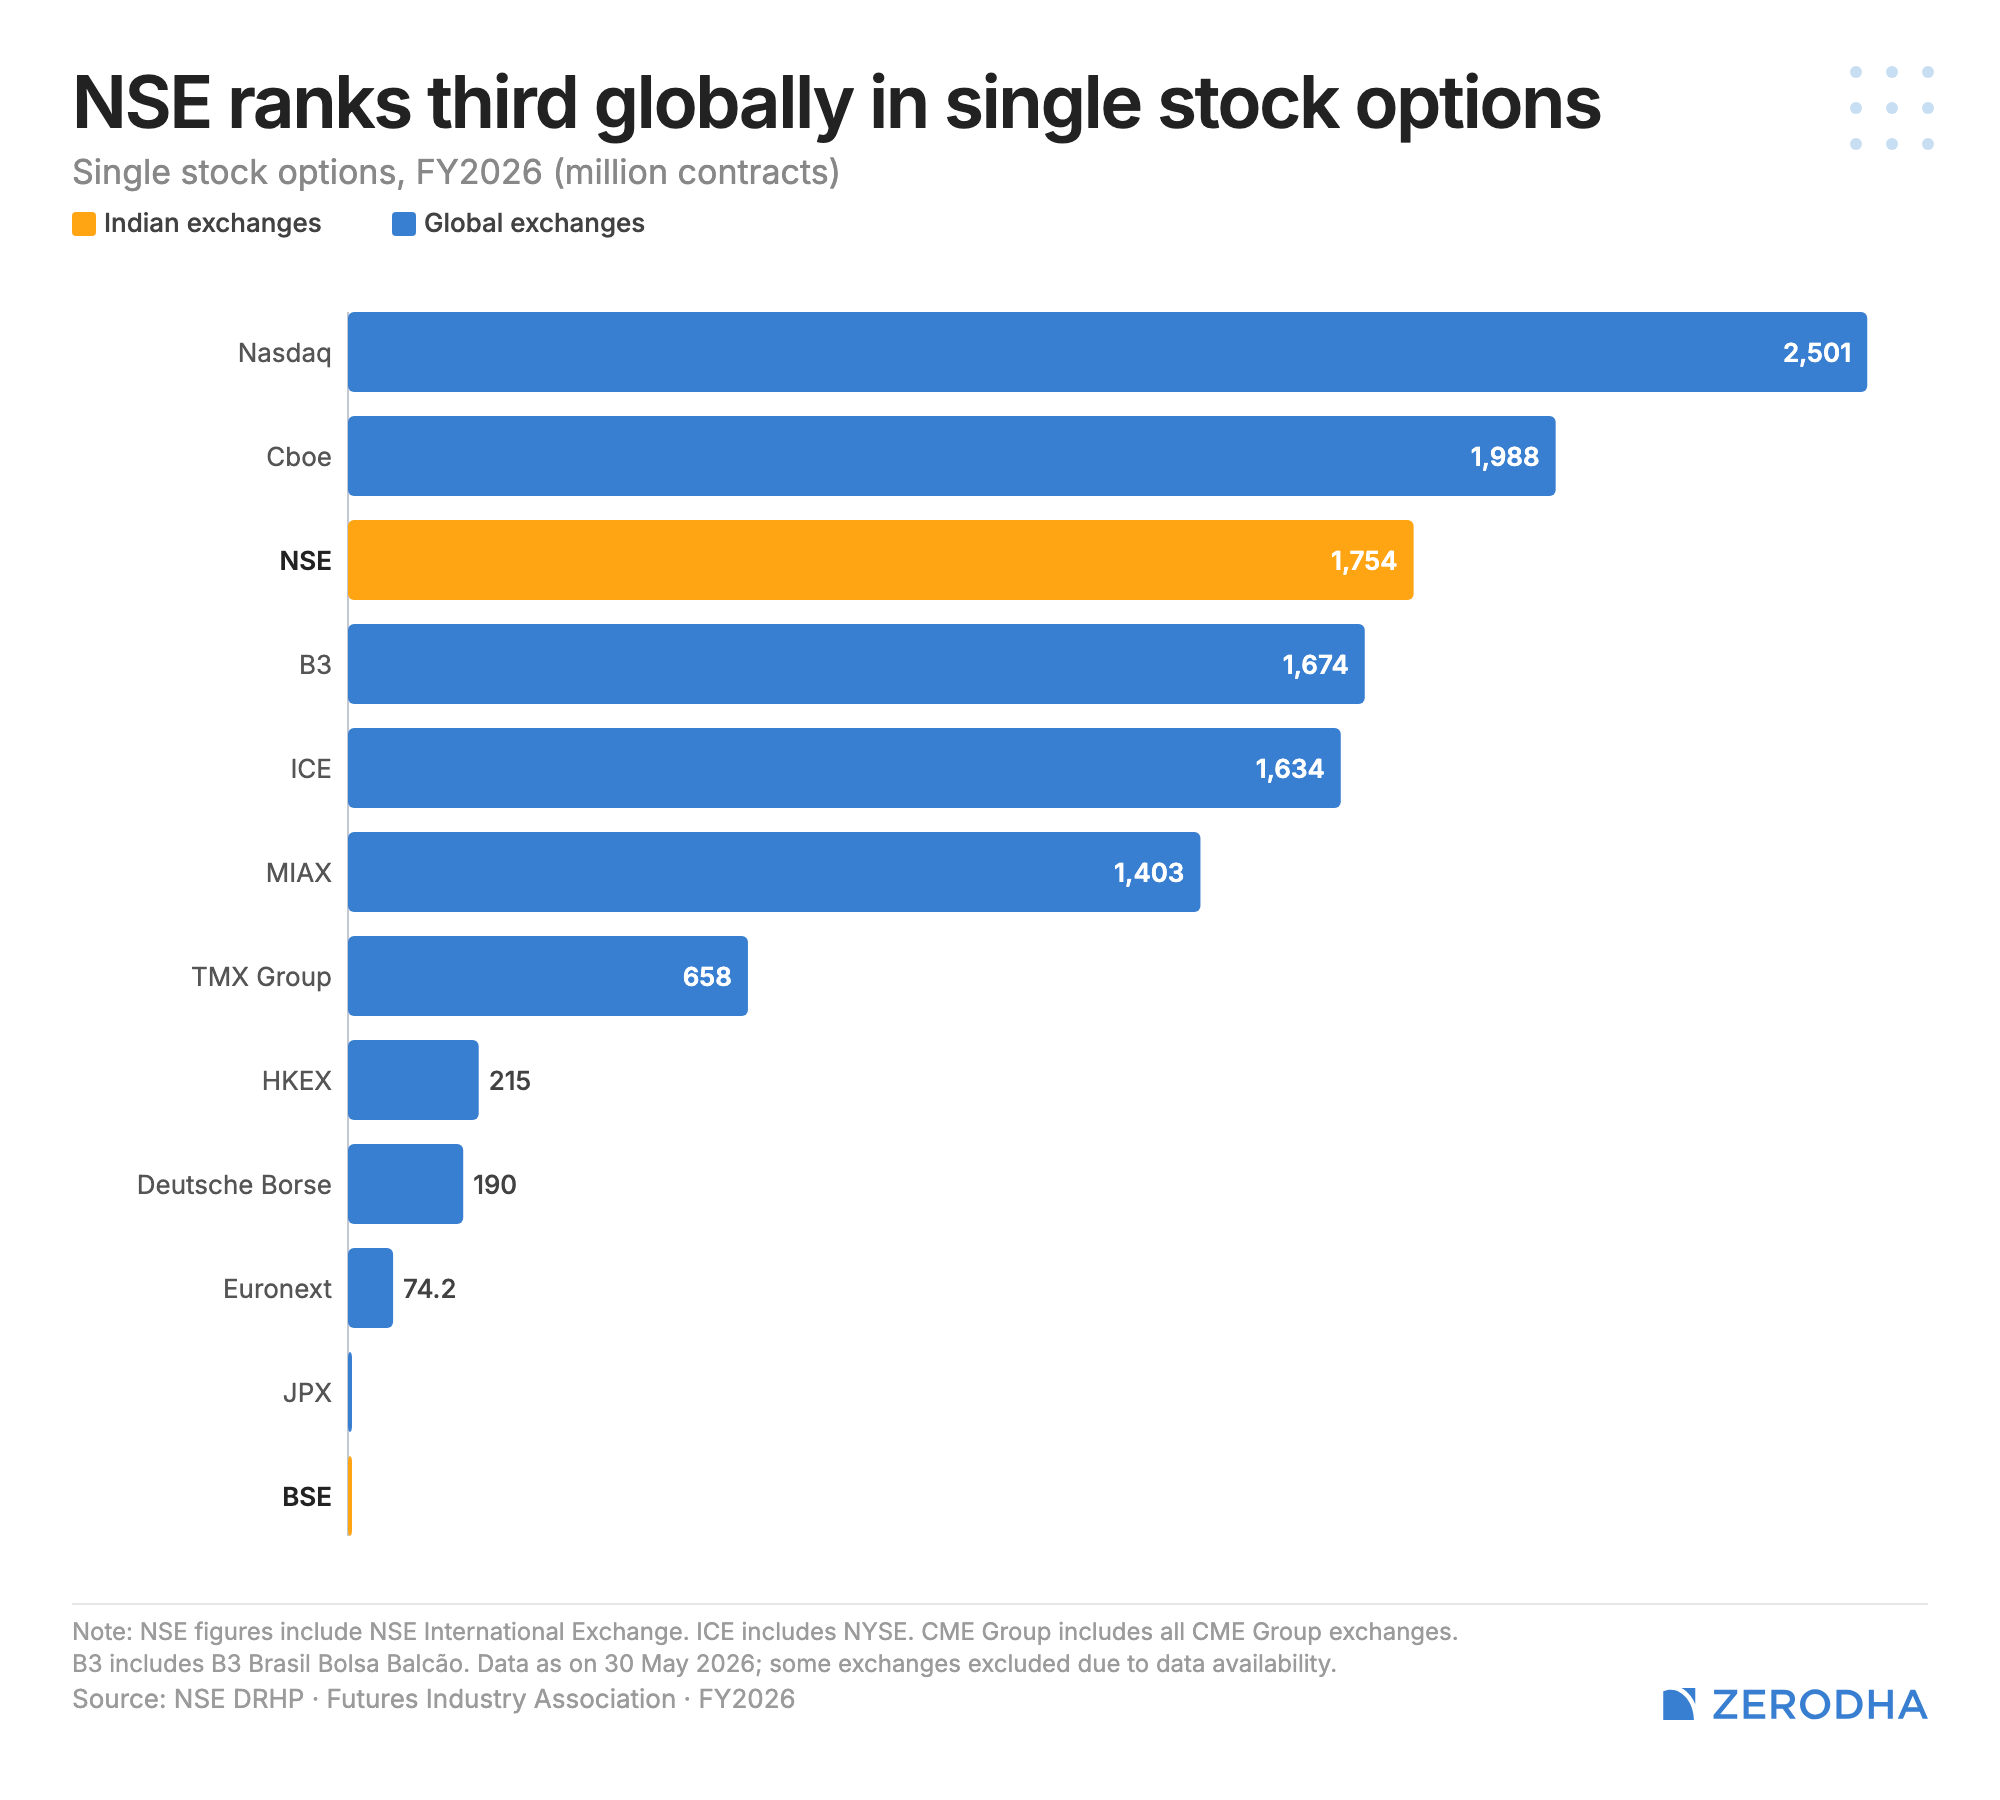
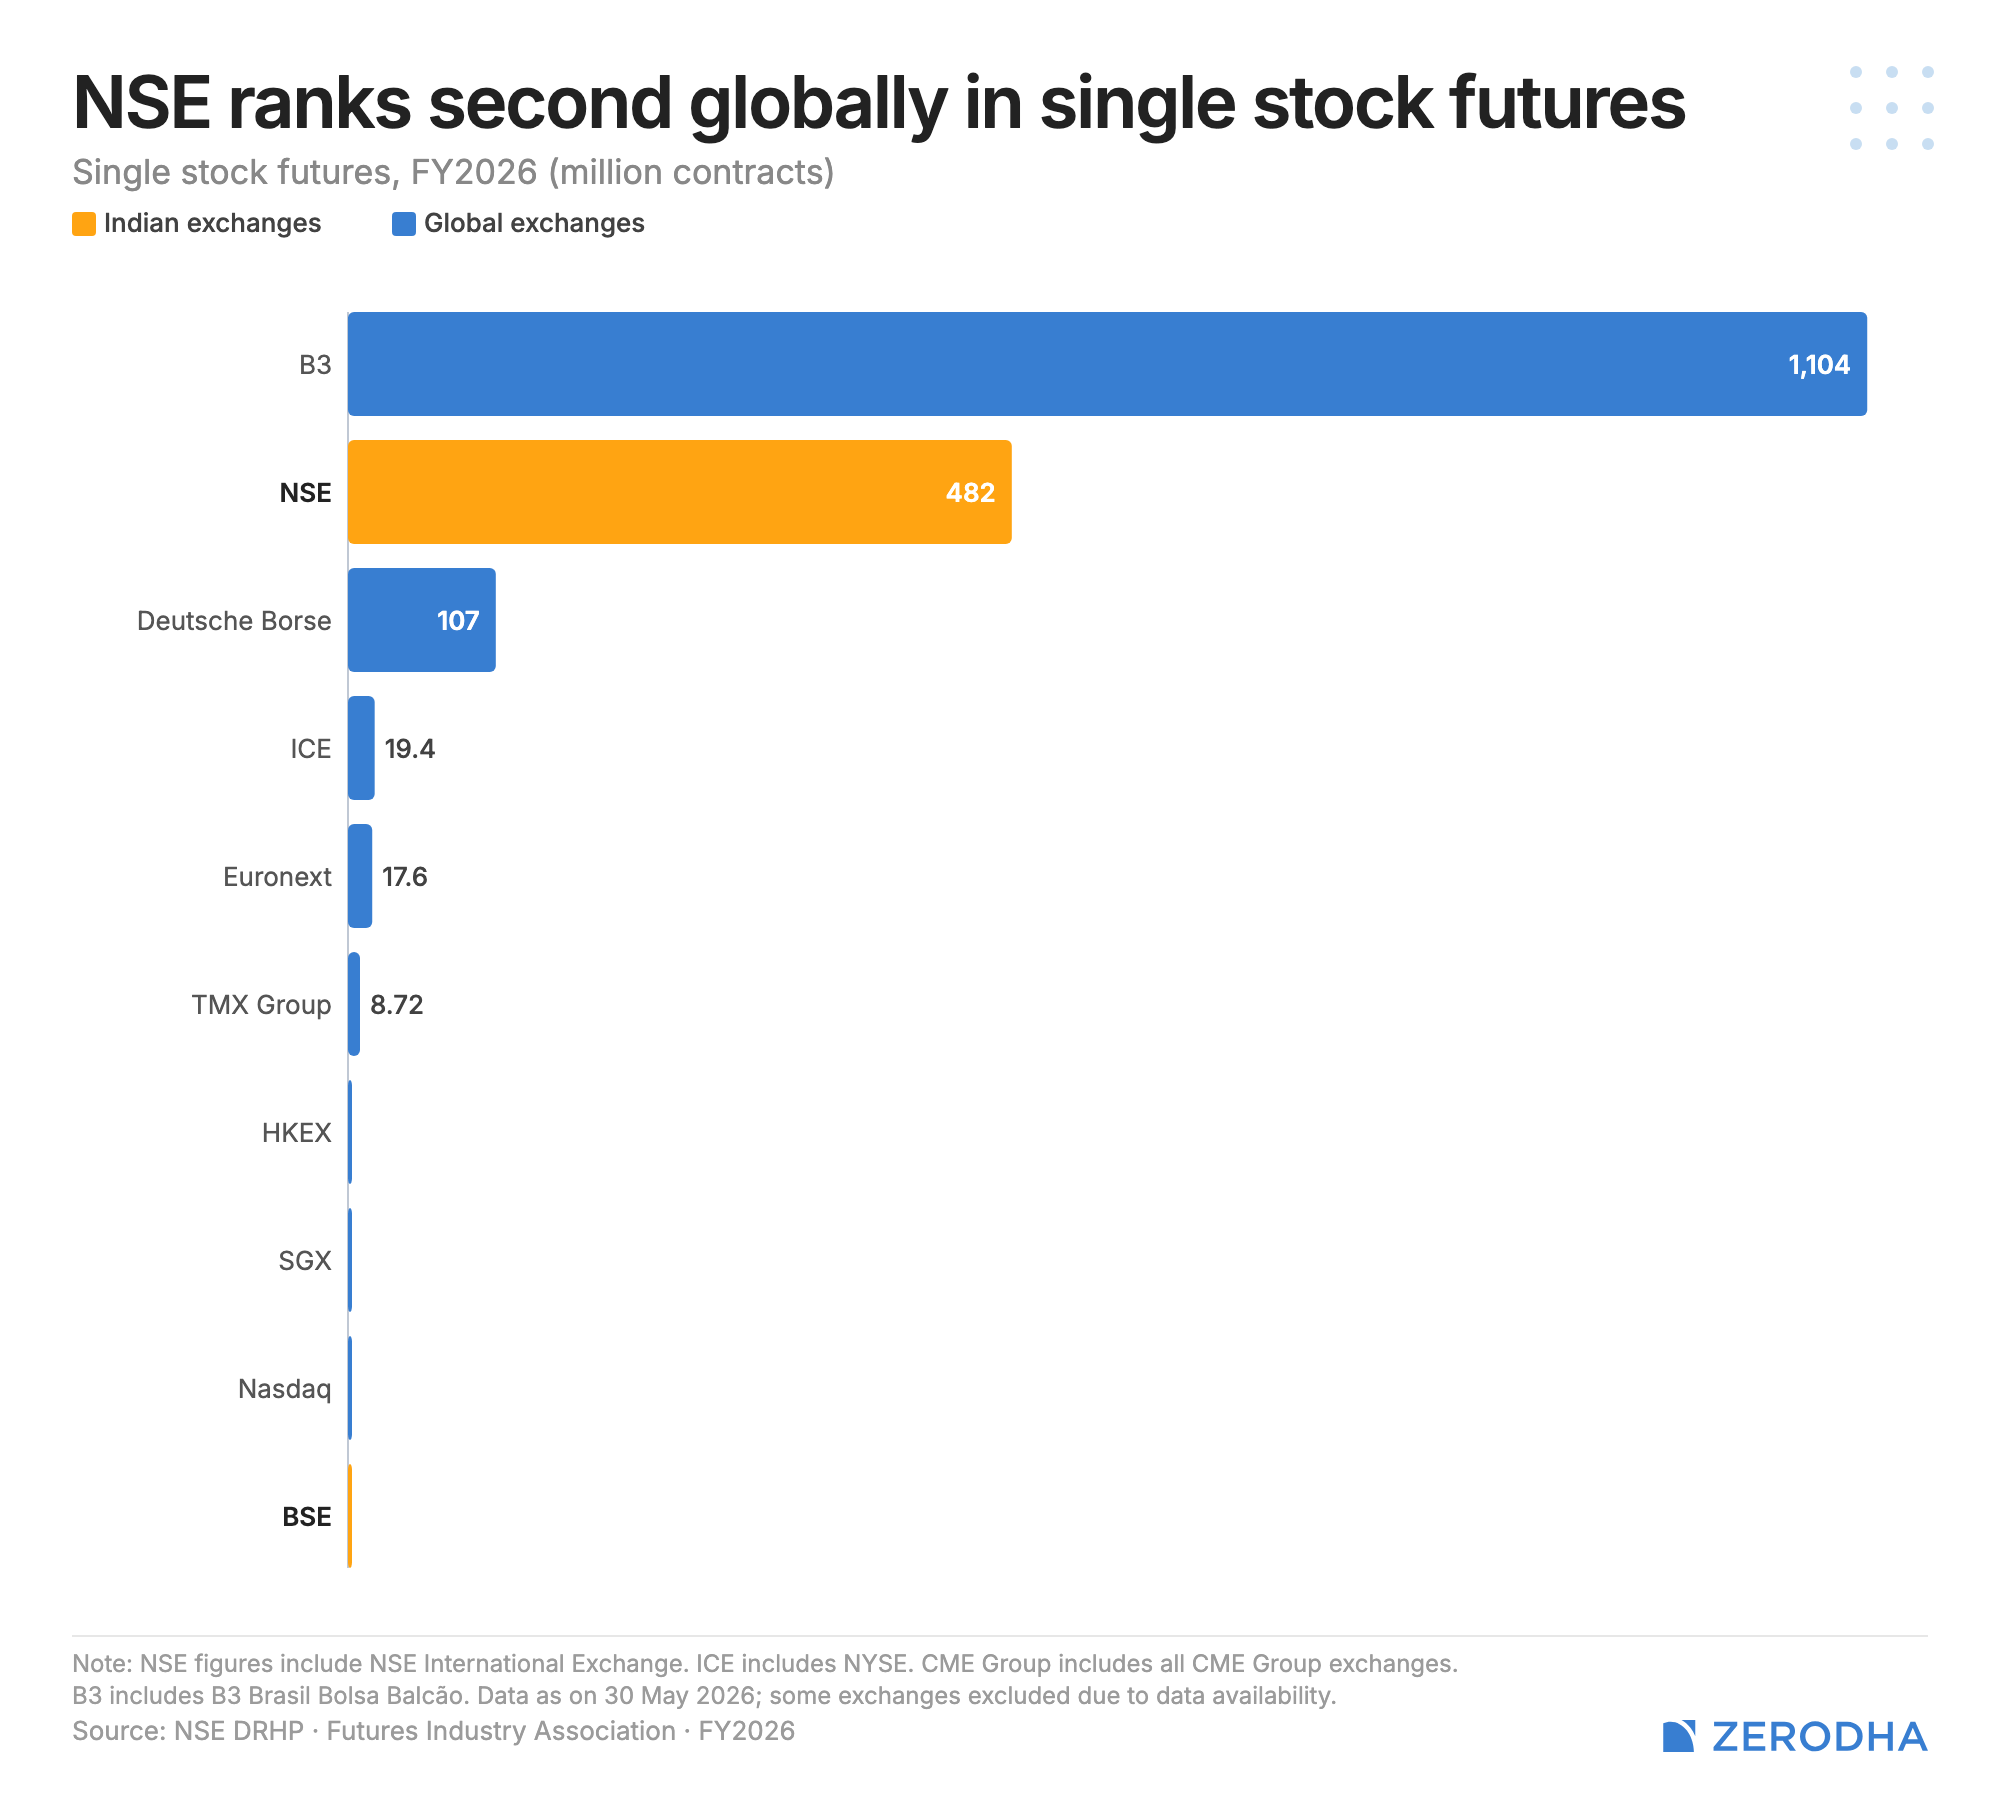
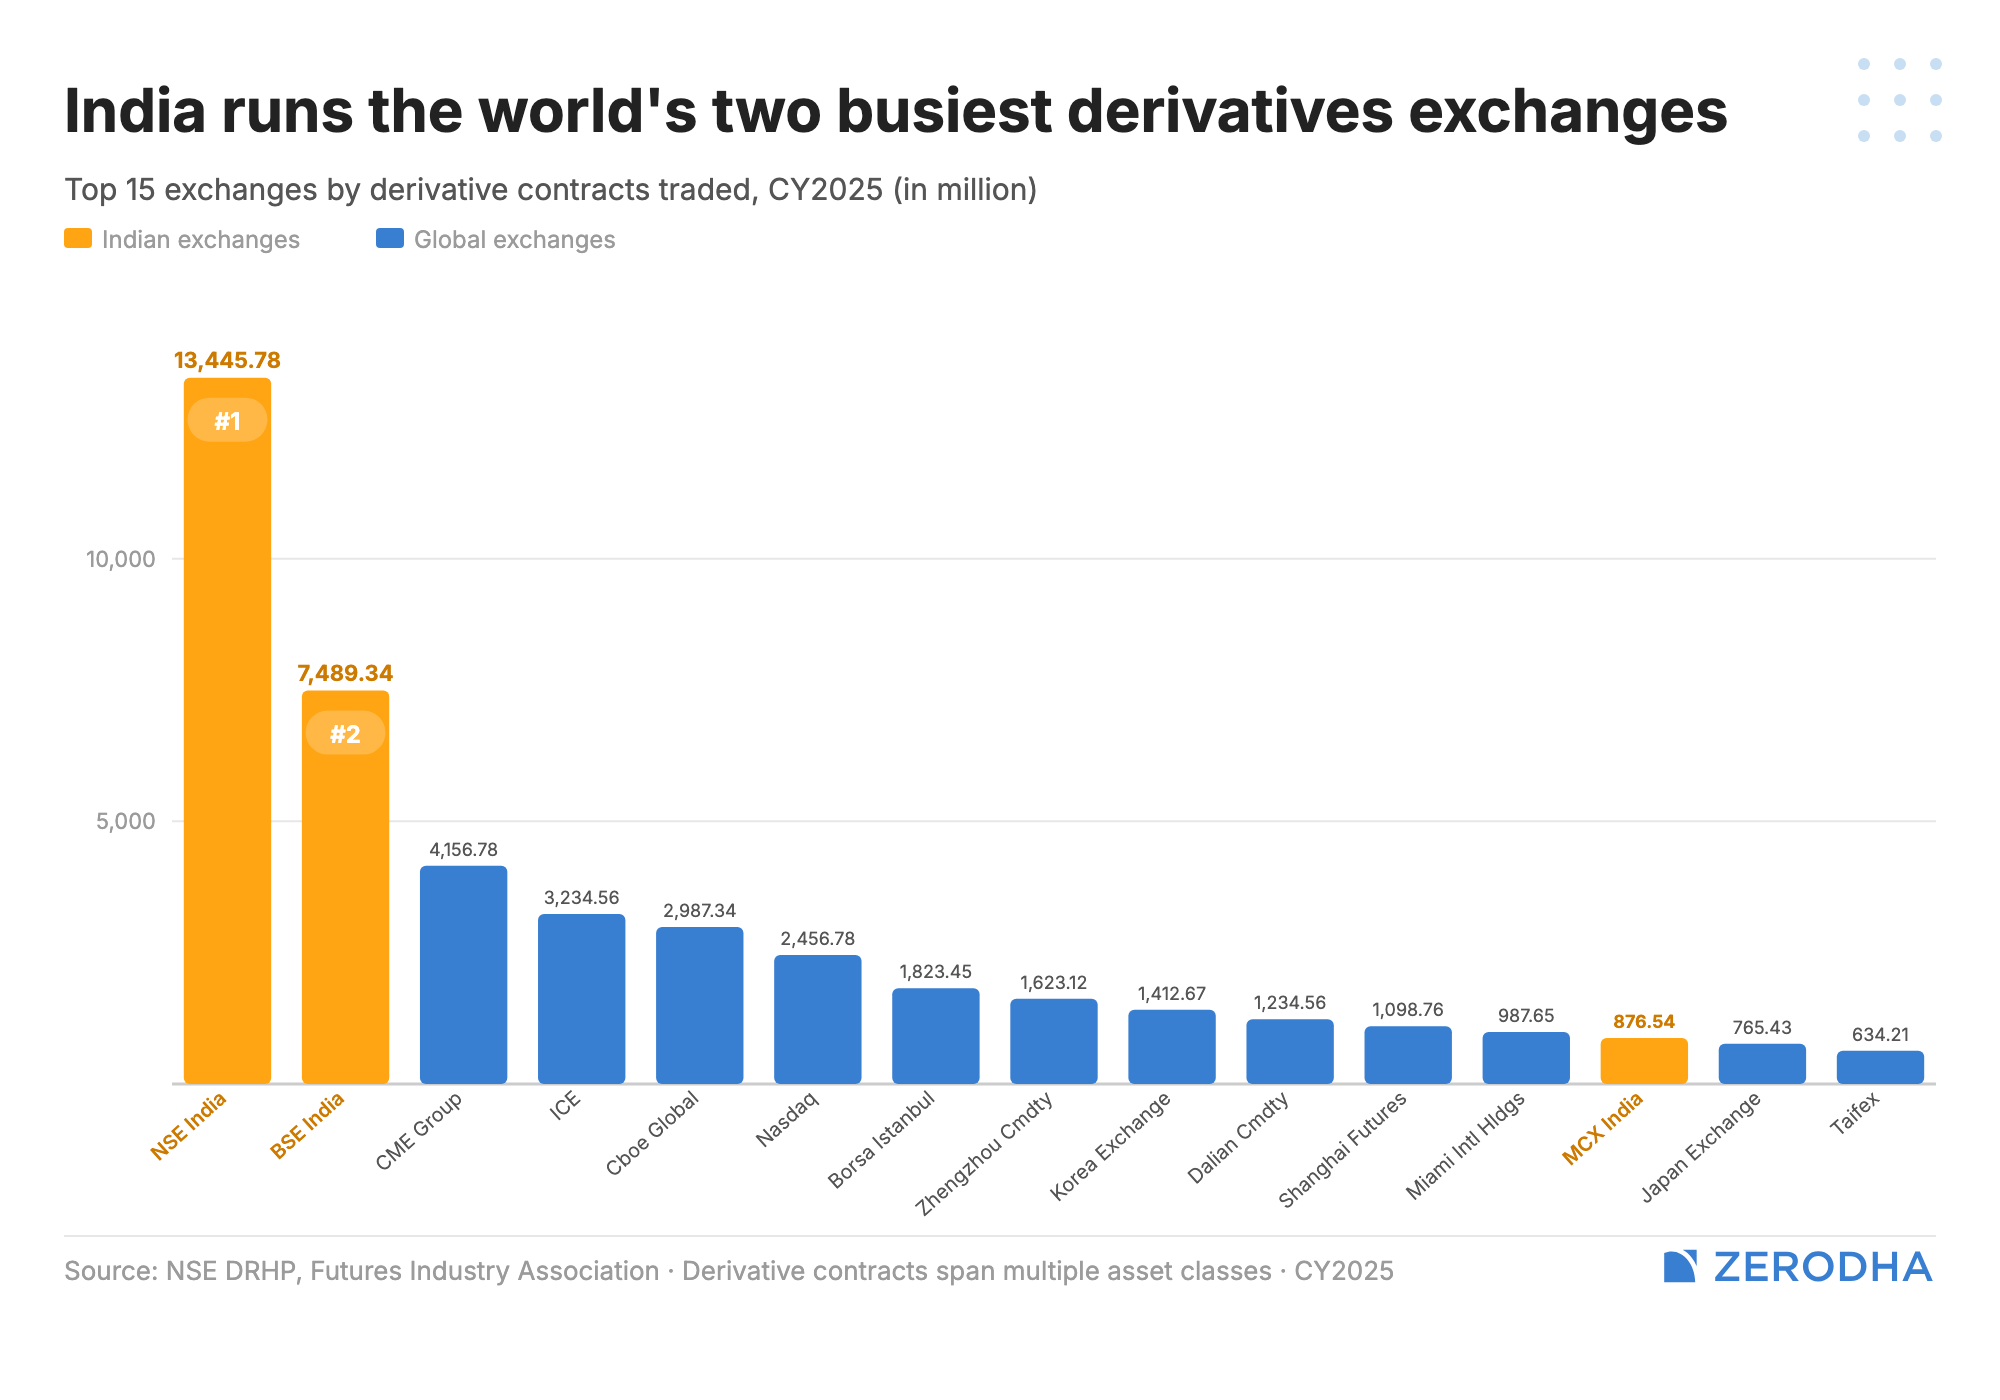
Indian derivatives trading is big yet small
One of the most misleading charts you’ll come across if you’ve spent any time following Indian markets is the one that proudly proclaims India to be the world’s largest derivatives market based on the number of contracts traded.
To put it mildly, this is a deeply flawed comparison.
The problem is that the absolute number of contracts traded is a largely meaningless metric when comparing derivatives markets across countries. What matters is not how many contracts are traded, or even the notional turnover they represent, but the premium turnover—the actual amount of money changing hands and being risked by traders.
Yet it’s common to see charts comparing the number of options contracts traded in India with those traded in the United States and then drawing sweeping conclusions about the size of the respective markets. I’ve written about this before, but the comparison simply doesn’t hold up.
When you compare India and the US using premium turnover instead of contract count, the picture changes dramatically. India’s derivatives market is still a fraction of the size of the US market. In fact, the difference is so large that India’s numbers barely register on the same chart.
This distinction also helps put another popular narrative into perspective—that vast numbers of Indians are speculating recklessly in derivatives markets. While options trading has undoubtedly exploded in recent years, the actual number of unique individuals actively trading options remains relatively small.
The NSE DRHP doesn’t provide this number, but various disclosures and industry estimates suggest that only around 15–20 lakh unique individuals actively trade options in India. That’s a meaningful number, but it’s a far cry from the impression one gets from headlines about India being the world’s largest derivatives market.
As with many things in finance, the choice of metric can completely change the story being told. In this case, counting contracts creates a dramatically distorted picture of both the size of India’s derivatives market and the extent of retail participation within it.

Bonds, coporate bonds
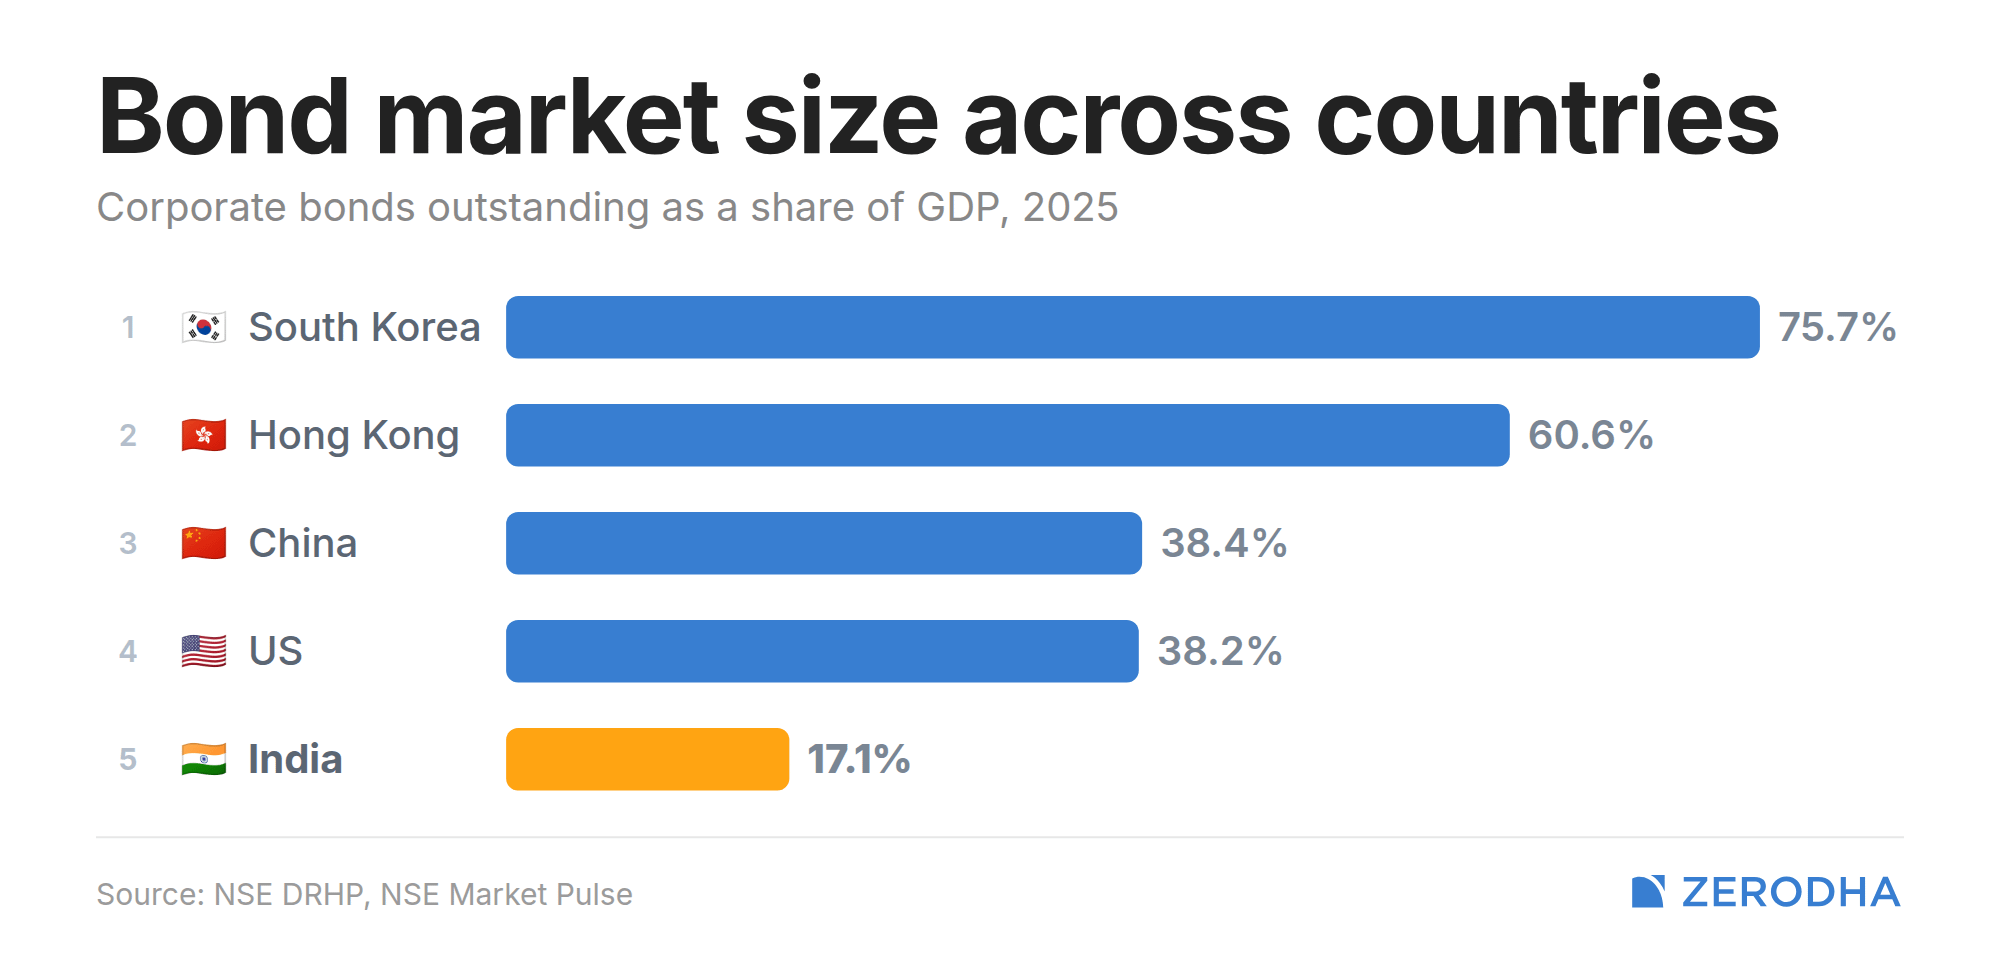
India has historically been a bank-dominated economy when it comes to funding businesses. While the corporate bond market may look large in absolute terms, it remains a relatively small percentage of GDP, which gives you a sense of how much room there is for growth.
What’s also worth noting is that the Indian bond market has traditionally been dominated by government securities. If I remember the numbers correctly, more than 60% of the bonds traded are G-Secs. In other words, the bond market has largely been a government bond market, with corporate bonds accounting for a much smaller share of activity.
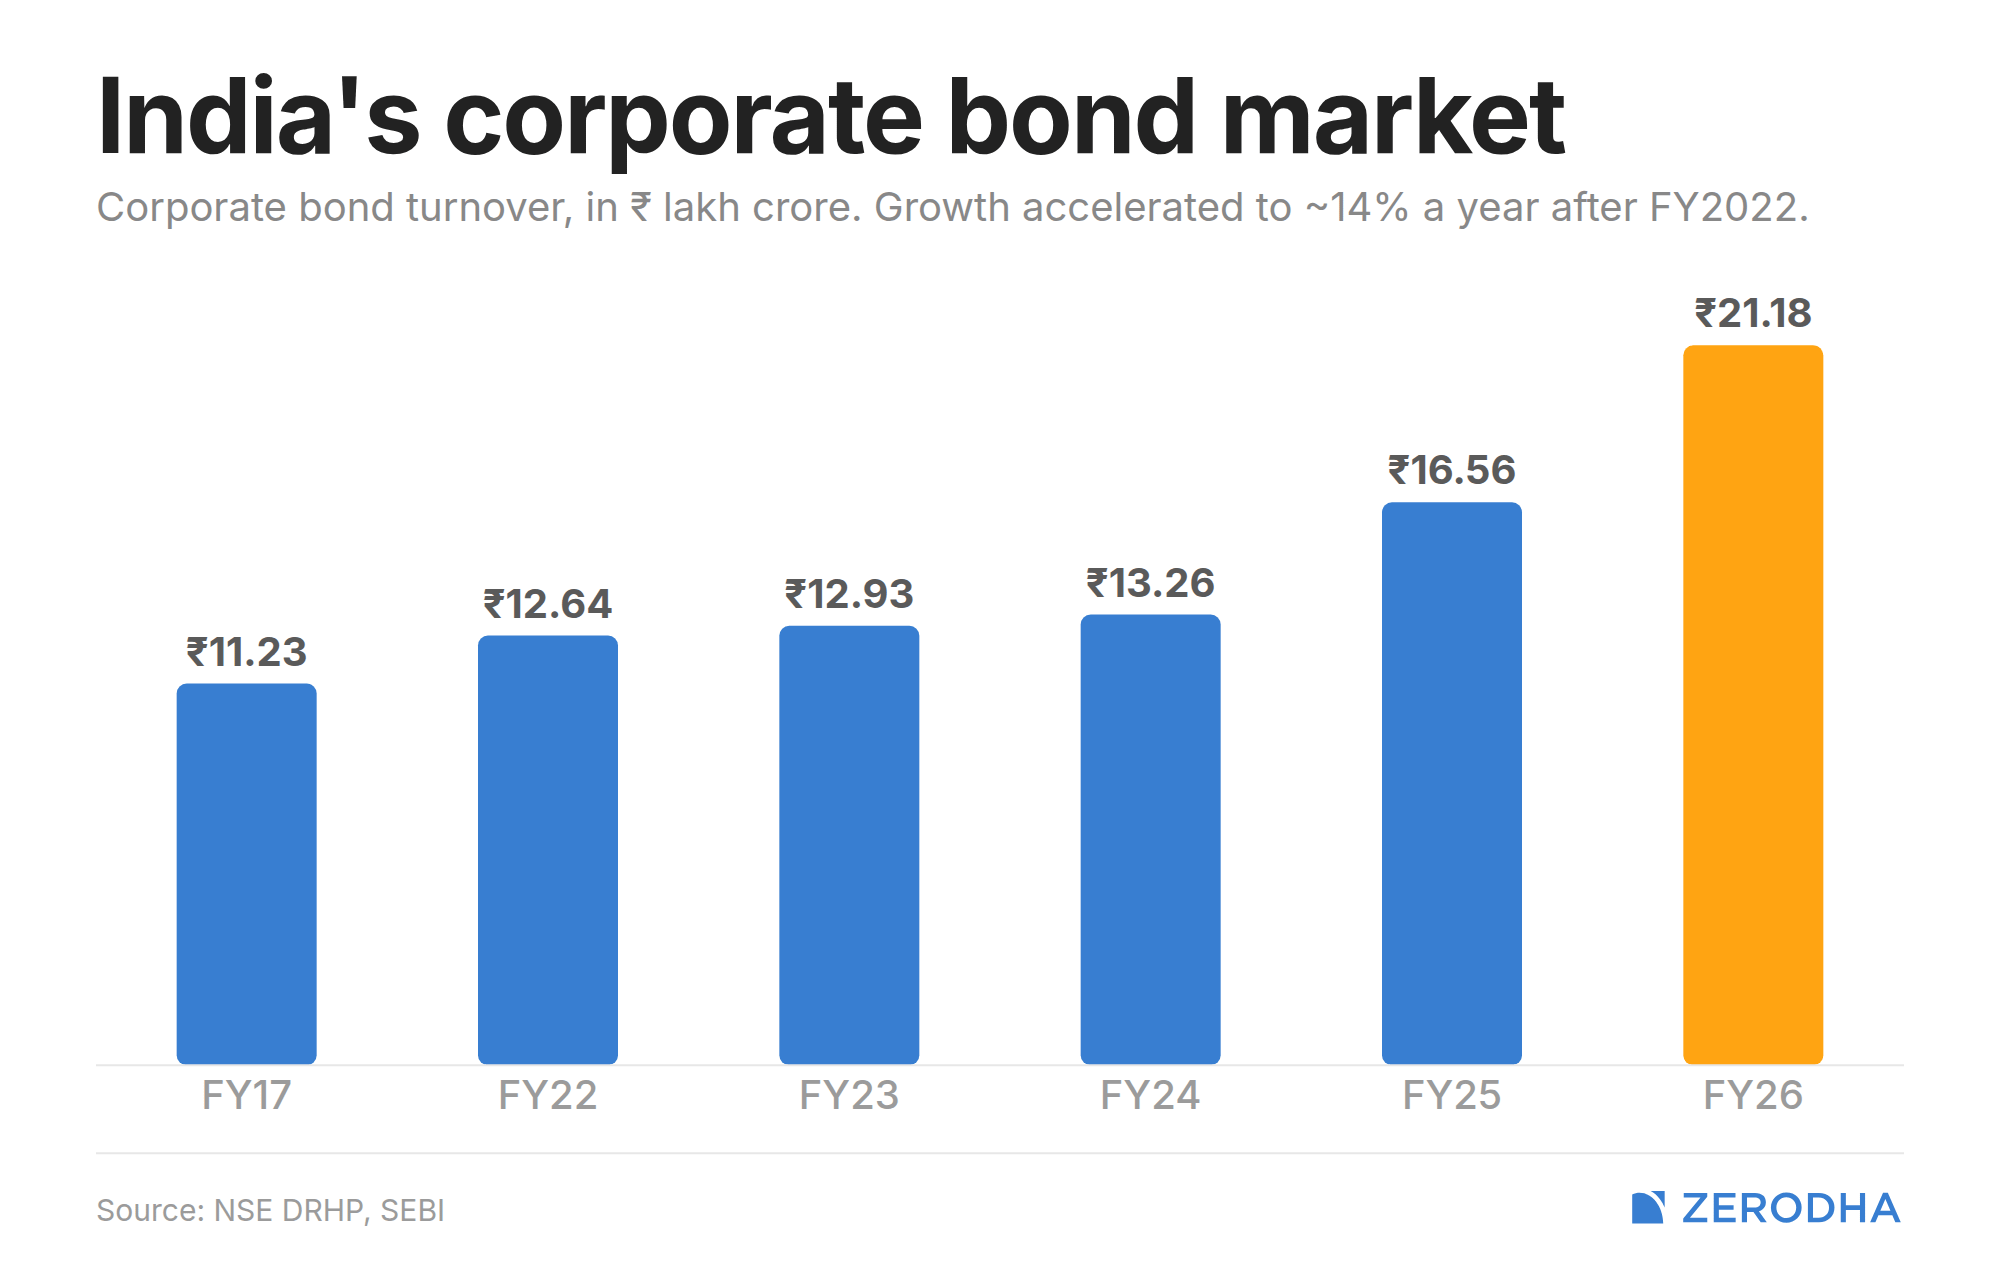
Corporate bonds have historically been unpopular for a variety of structural, regulatory, and taxation-related reasons. As a result, companies have generally found it easier to raise money from banks rather than directly from debt markets. For a long time, growth in the corporate bond market was fairly stagnant.
That said, there have been signs of life in recent years. Over the last six or seven years, a number of regulatory changes have been aimed at deepening debt markets and improving access. At the same time, awareness of bonds as an asset class has increased, and we’re beginning to see more interest from retail investors as well.
This is one area of the market that I would keep an eye on. A deeper corporate bond market doesn’t just create another asset class for investors. More importantly, it gives companies an additional avenue to raise capital, especially those that may not have easy access to bank funding. It also creates competition for banks, which in turn could make borrowing costs more competitive.
It’s still early days, and India’s corporate bond market remains underdeveloped relative to the size of the economy. But if there is one segment of Indian capital markets that has significant room to grow over the coming decade, it is probably this one.
Projected growth of turnover
There’s a funny saying that goes something like this: only two people know what will happen in the future—God and a liar.
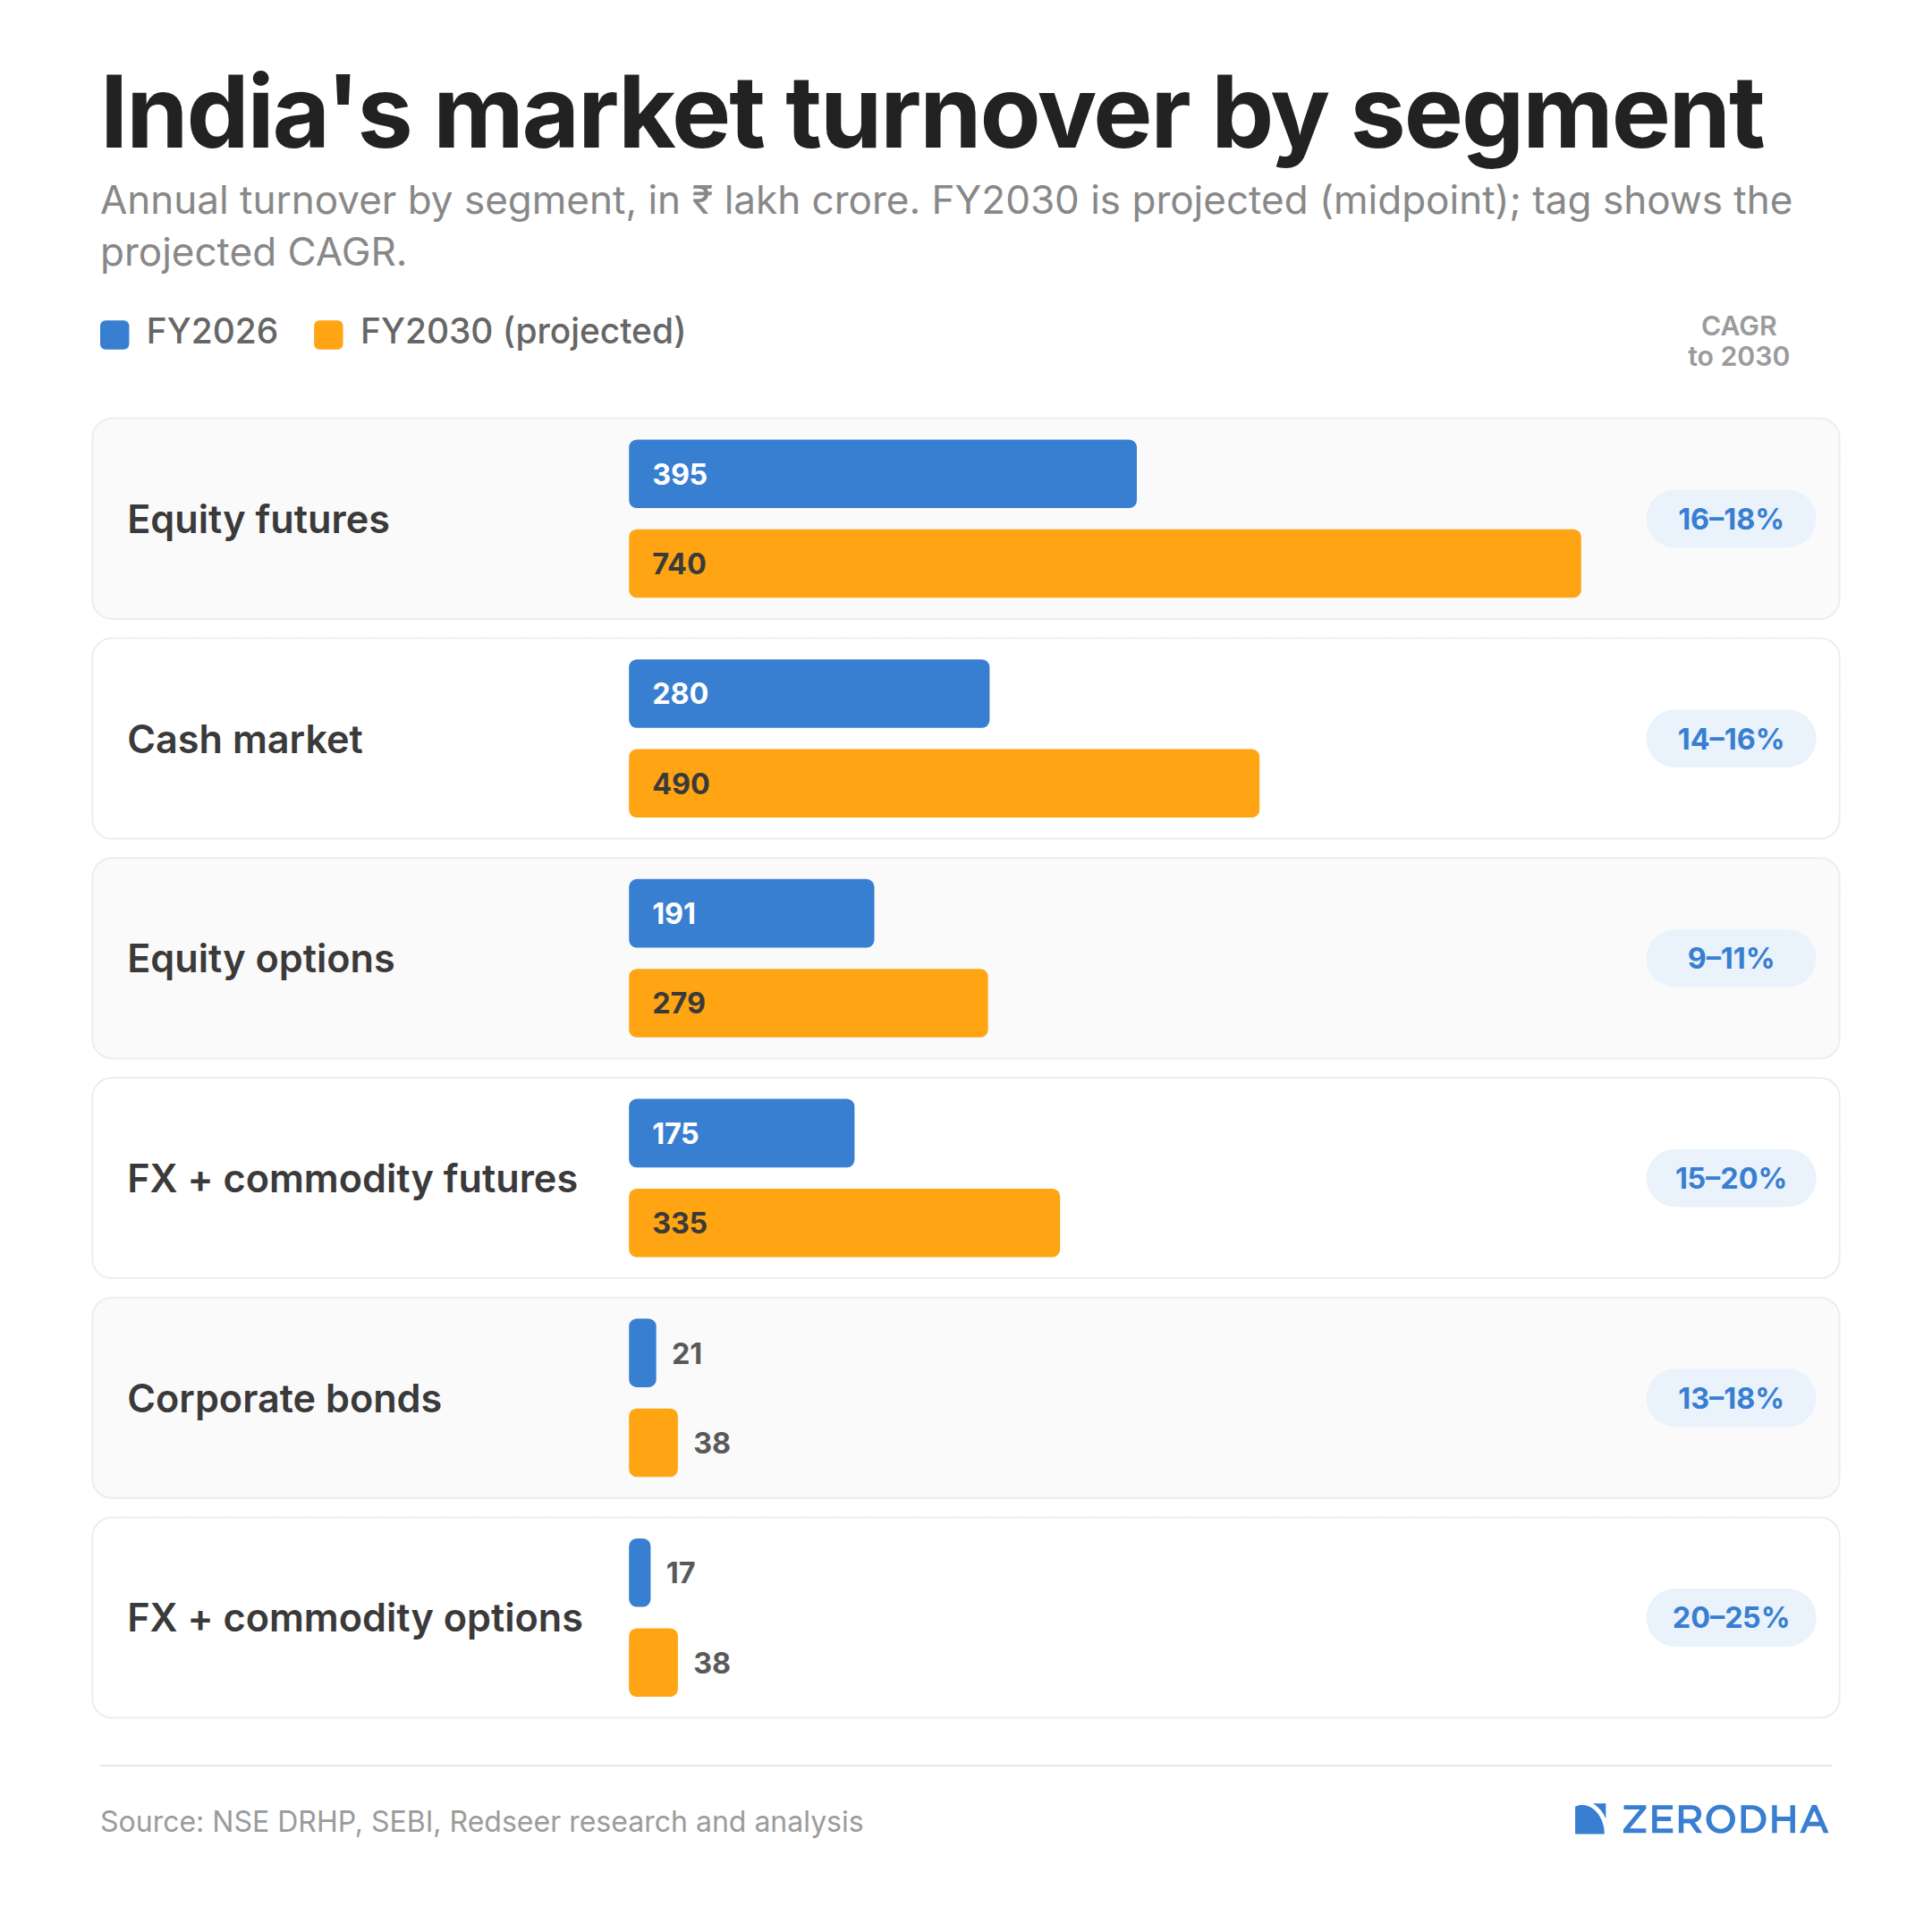
The reason I bring that up is that the NSE’s DRHP includes projections for the future growth of turnover across various market segments. Now, if there’s one thing anyone who has spent time in financial markets learns, it’s that predicting the future is extraordinarily difficult. Markets have a habit of humbling anyone who becomes too confident about what comes next.
That said, it’s still interesting to see the assumptions built into these projections. The NSE is clearly quite bullish on the long-term growth of Indian capital markets, whether in cash equities, derivatives, or other segments.
Of course, one could argue that a certain degree of optimism is to be expected. After all, the exchange is in the process of going public and is telling its story to prospective investors. But even with that caveat, the projections offer a useful glimpse into how the NSE itself thinks about the future trajectory of Indian markets.
Whether reality ultimately matches those expectations is another matter entirely. If history teaches us anything, it’s that markets are very good at surprising both optimists and pessimists alike.
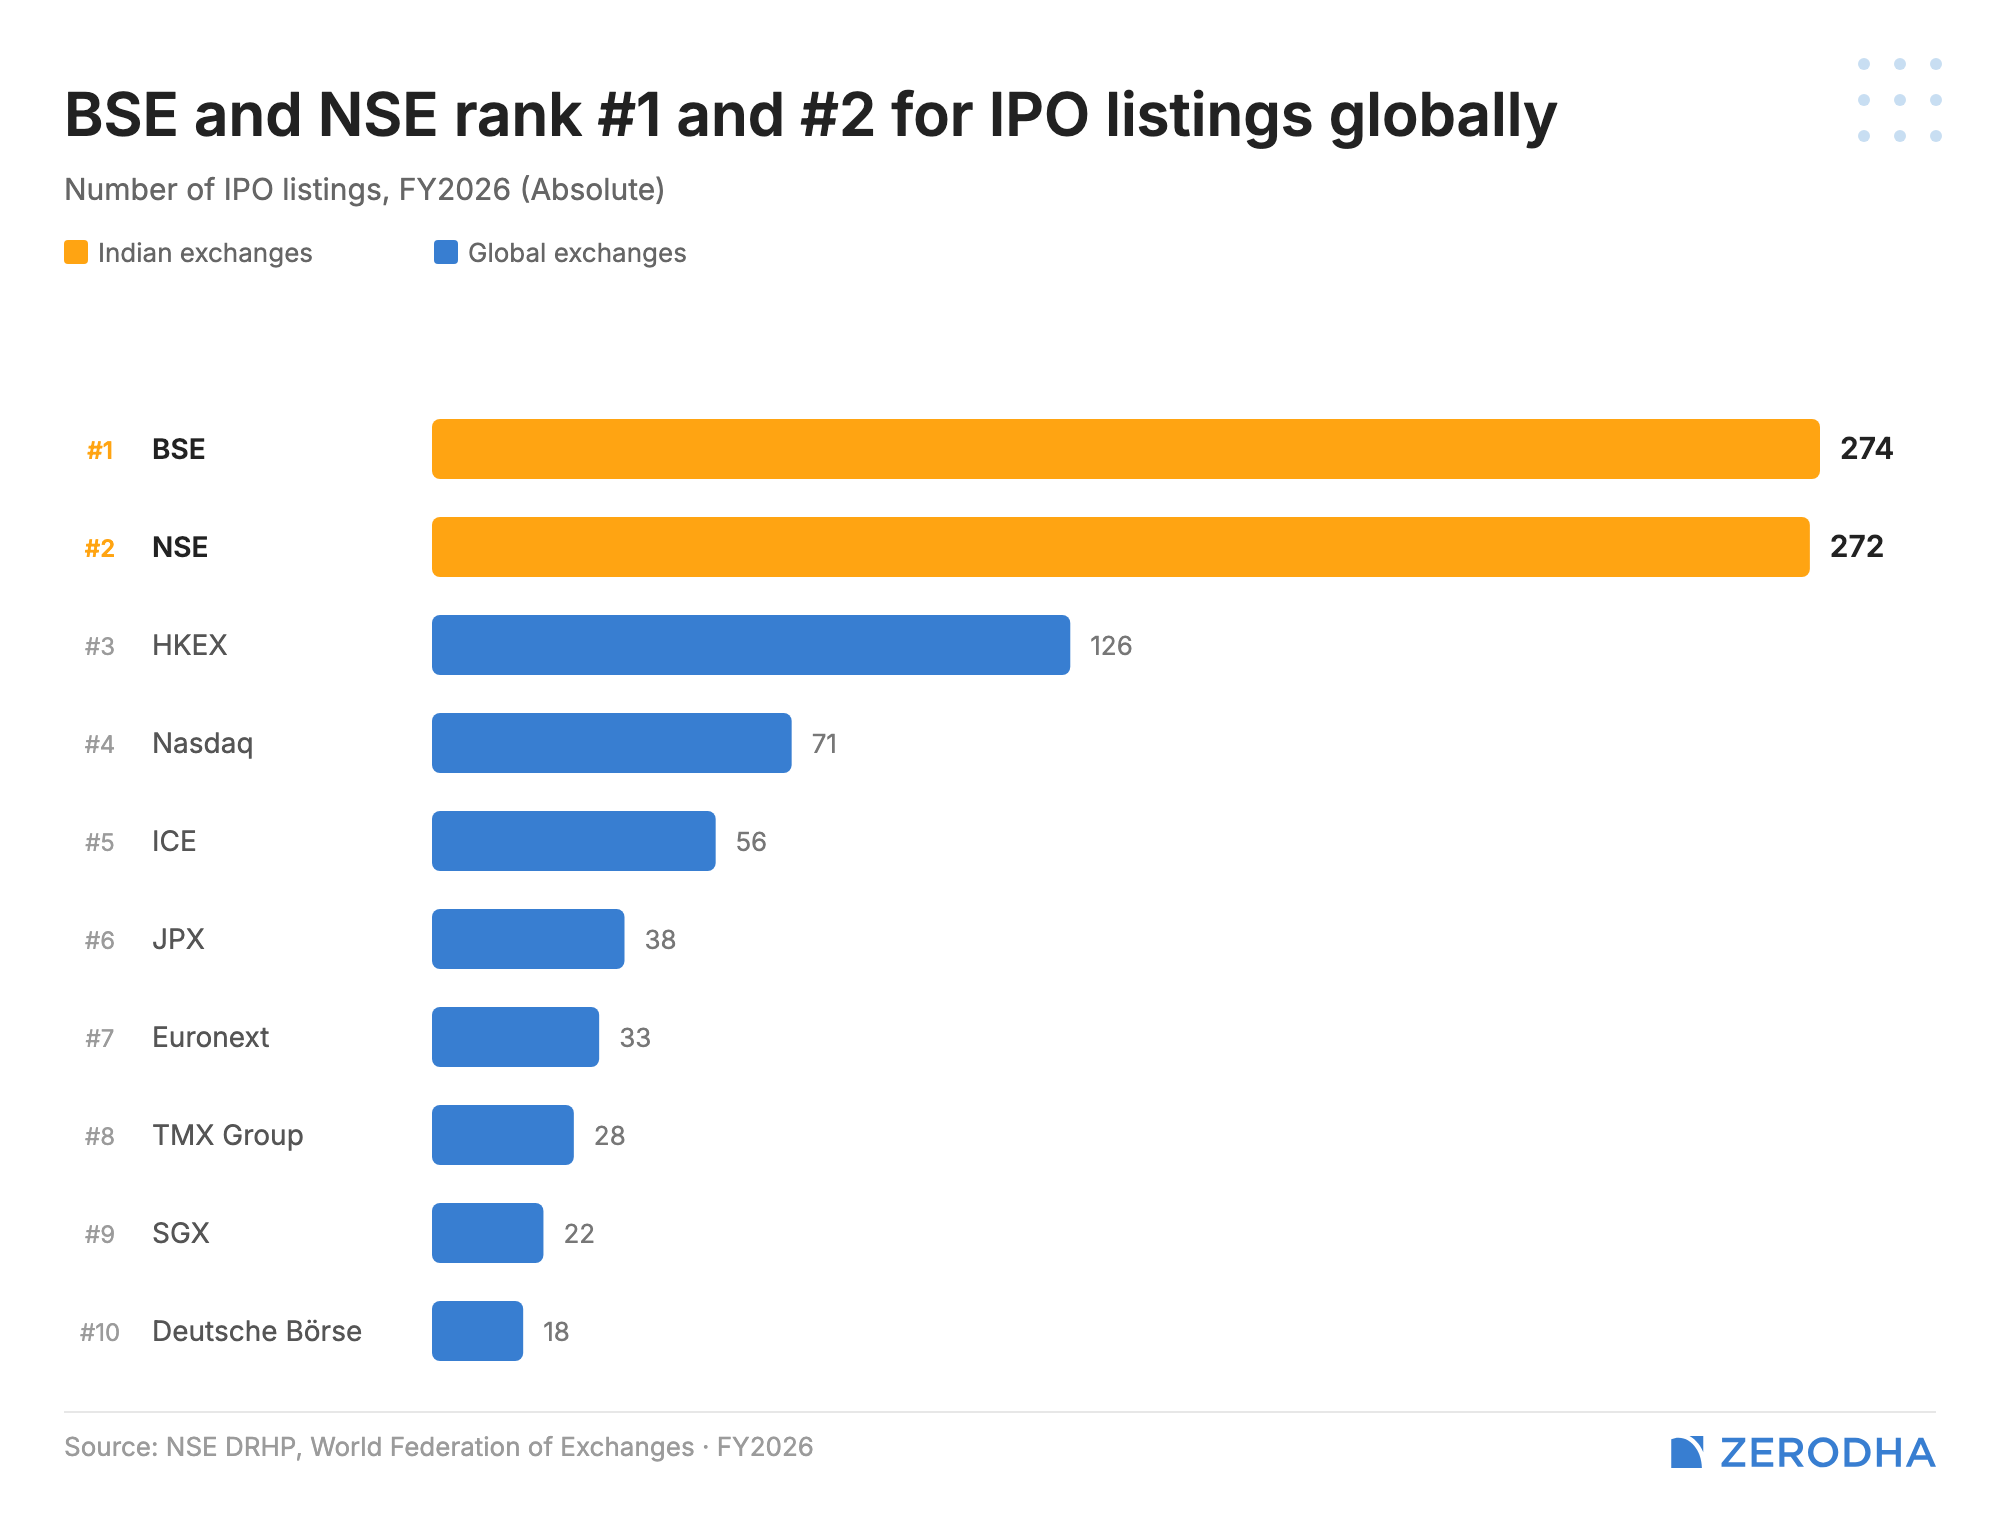
The IPO boom
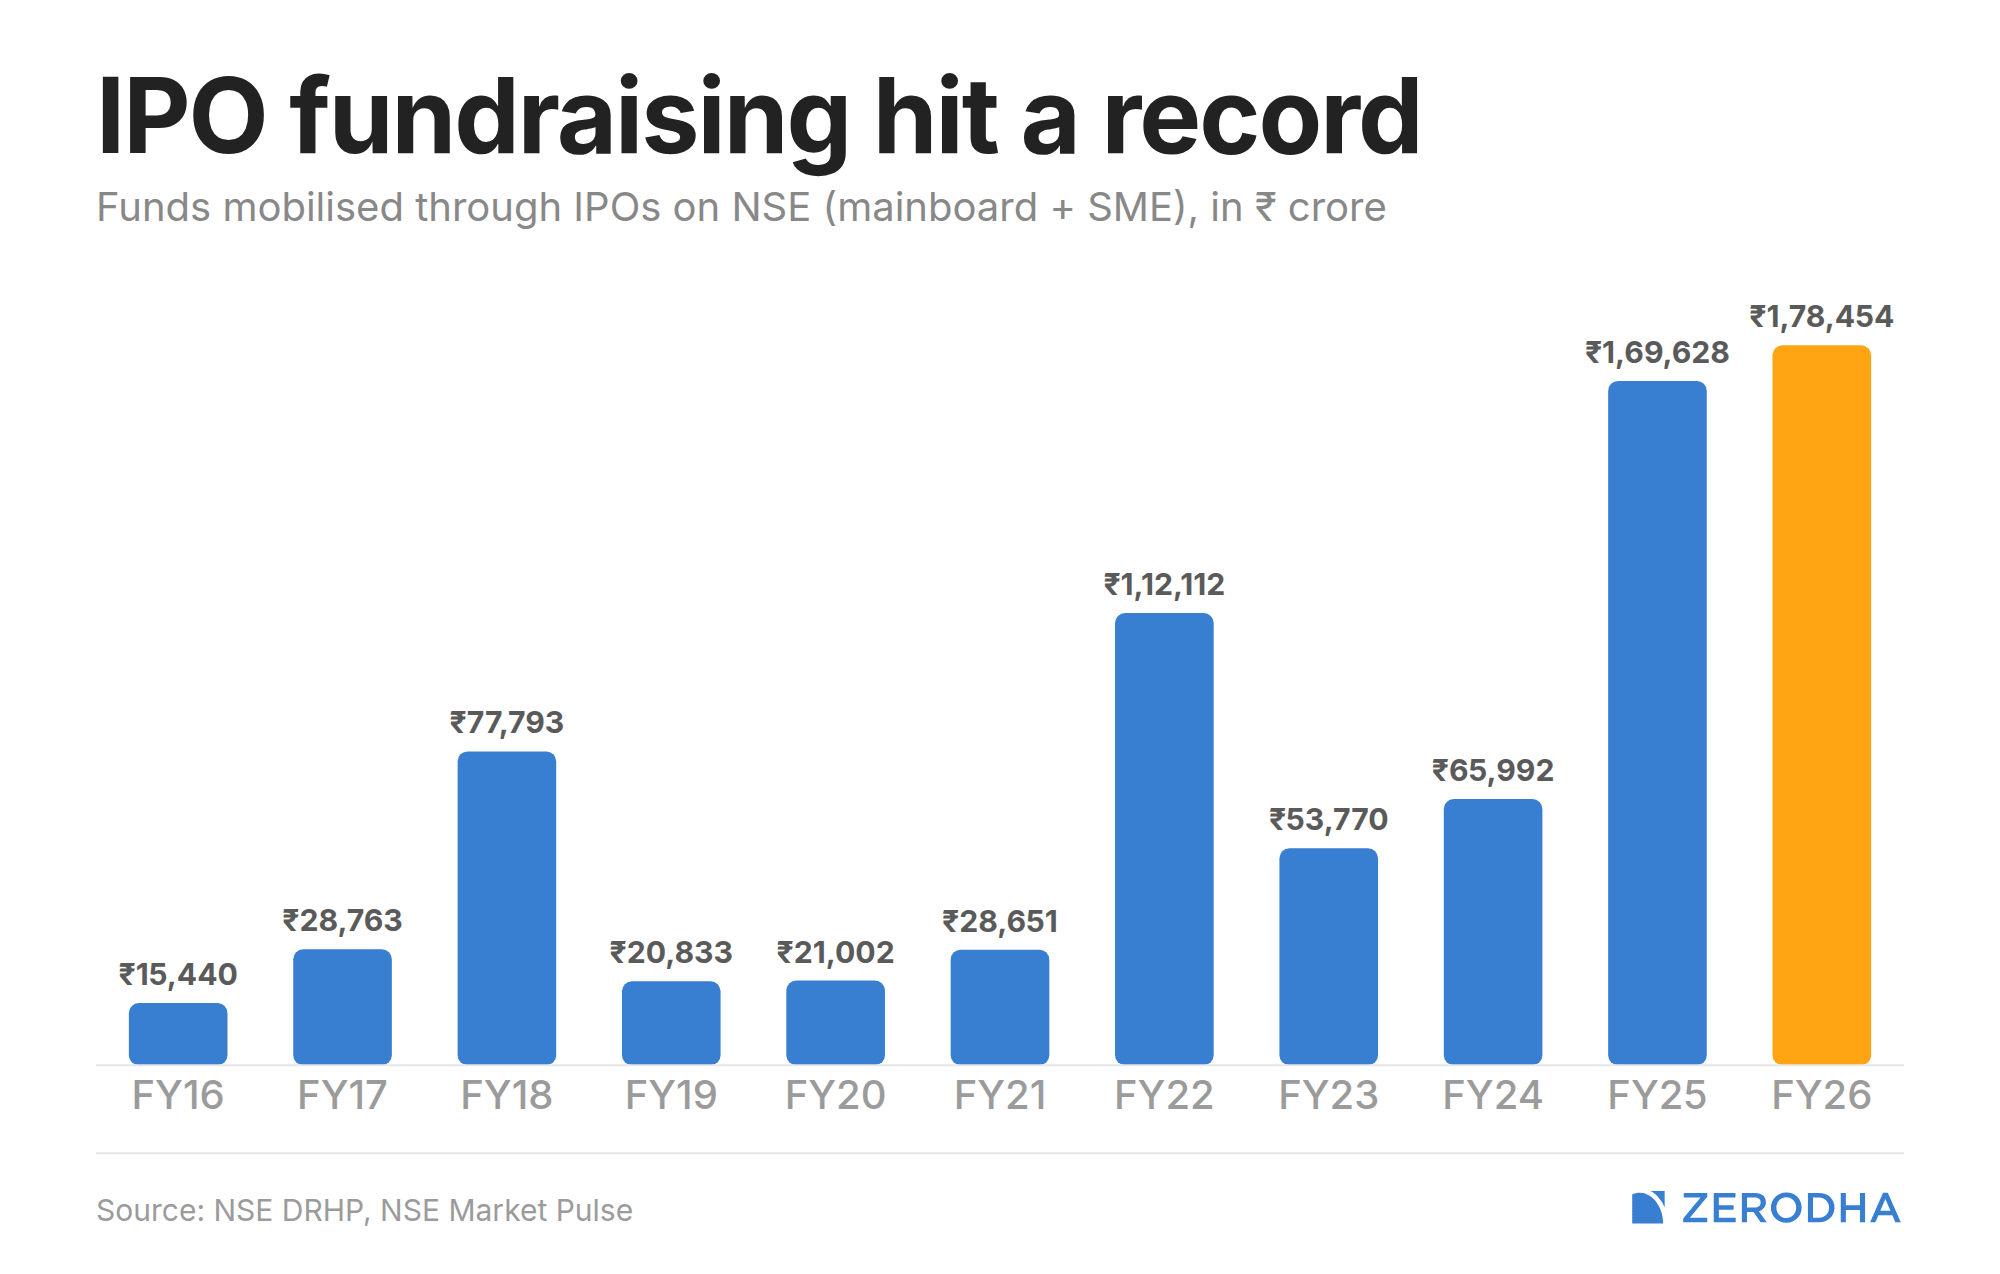
Thanks to the exuberance in the markets after 2020, IPO activity increased spectacularly. Both the number of IPOs and the total amount of capital raised hit record levels, finally giving many of the PE and VC funds that had invested in India after 2012–13 an opportunity to exit.
And that’s actually a good thing.
As an aside, this is one of the reasons why I think people often misread the recent FDI outflows. Many see them as a negative, but a portion of those outflows simply reflects investors exiting through public markets. Investors need deep and liquid capital markets to realize returns on their investments. In fact, the existence of a credible exit mechanism is one of the reasons they’ll continue to invest in the first place. They’ll only come back if they know they can eventually get out.
But anyway, I digress.
The IPO numbers still surprise me. Even after having watched the markets closely through this period, it’s remarkable just how much they’ve increased in such a short span of time.
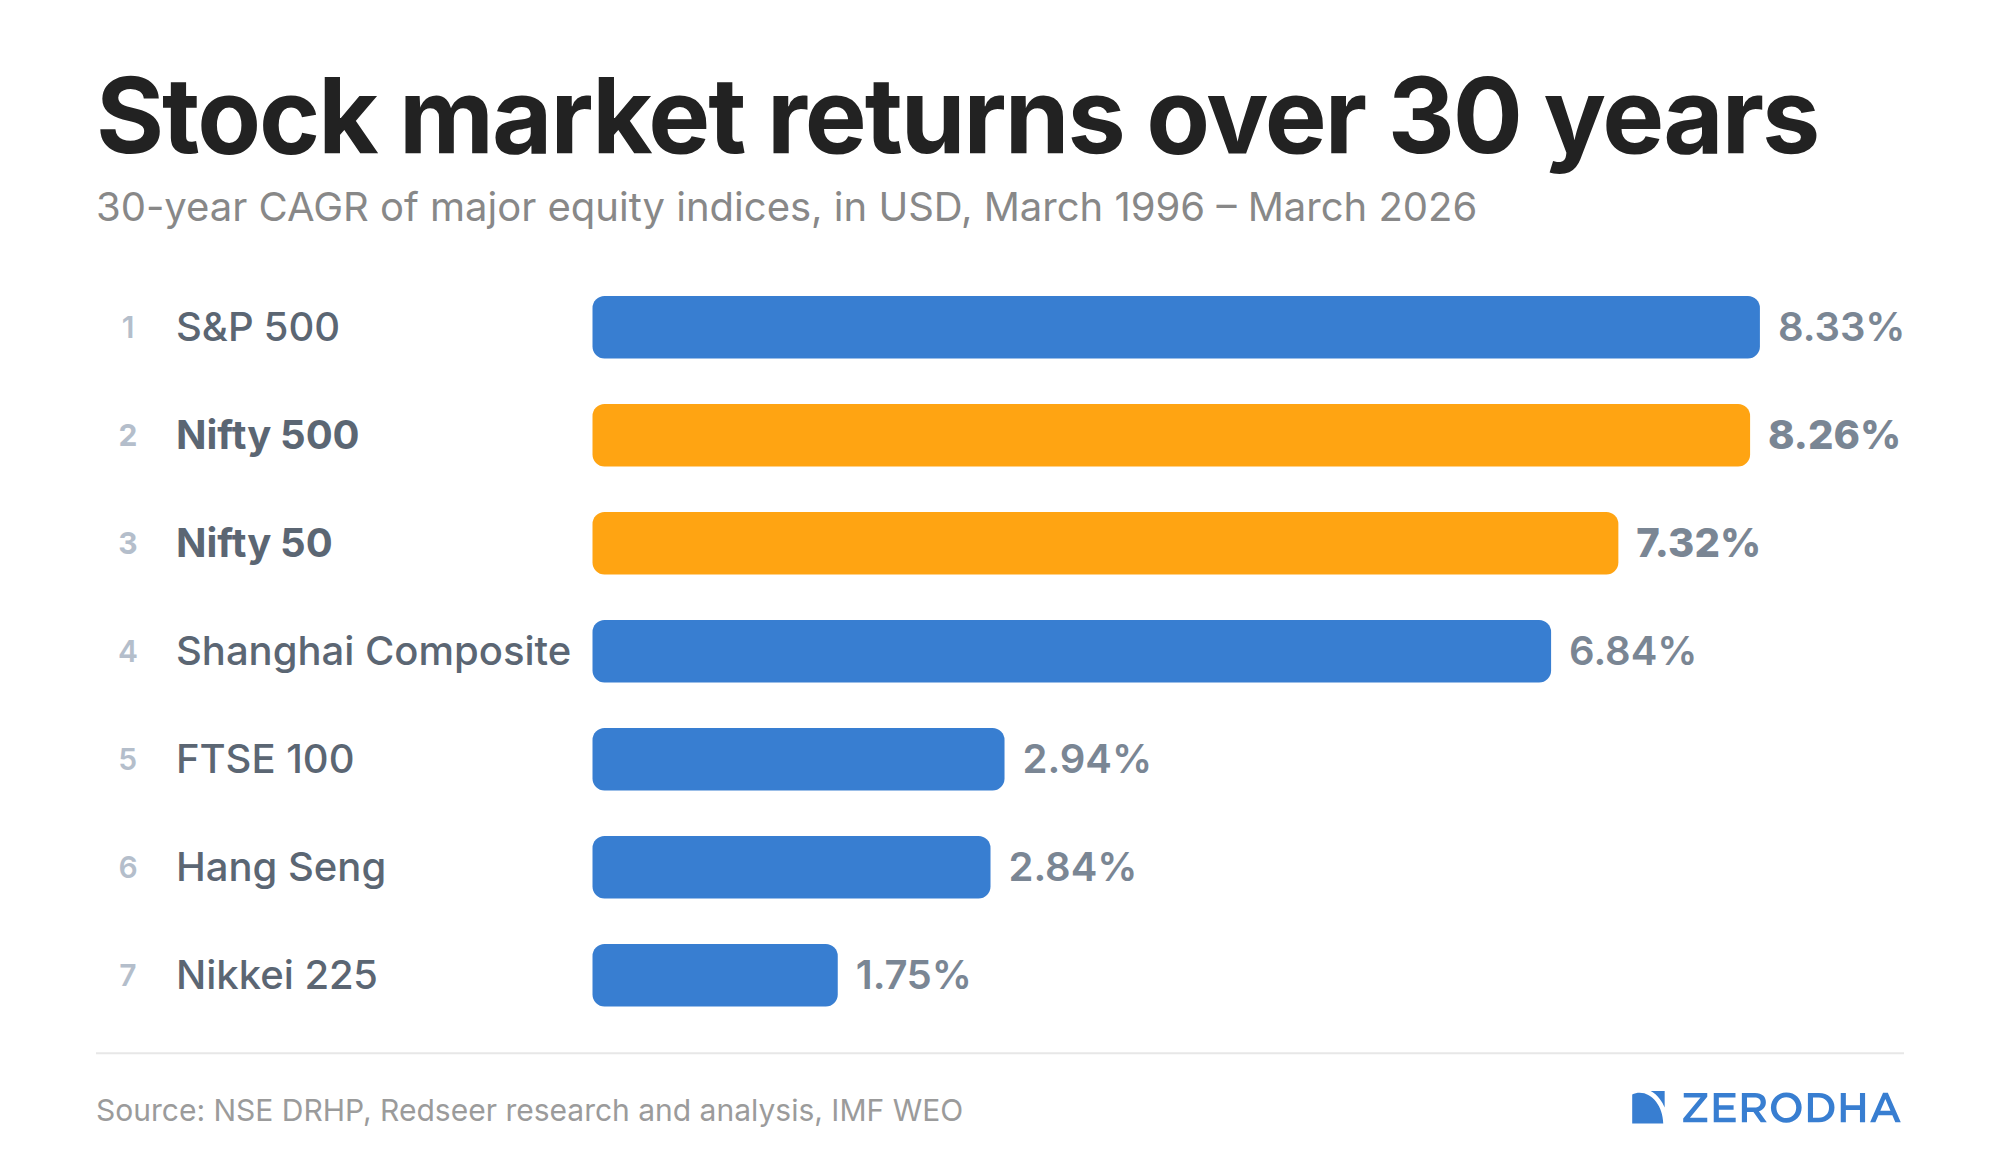
Nifty vs S&P 500 returns in $
Despite all the noise about rupee depreciation, etc. Over the long term, Indian markets, even in dollar terms, have delivered returns similar to the US market.
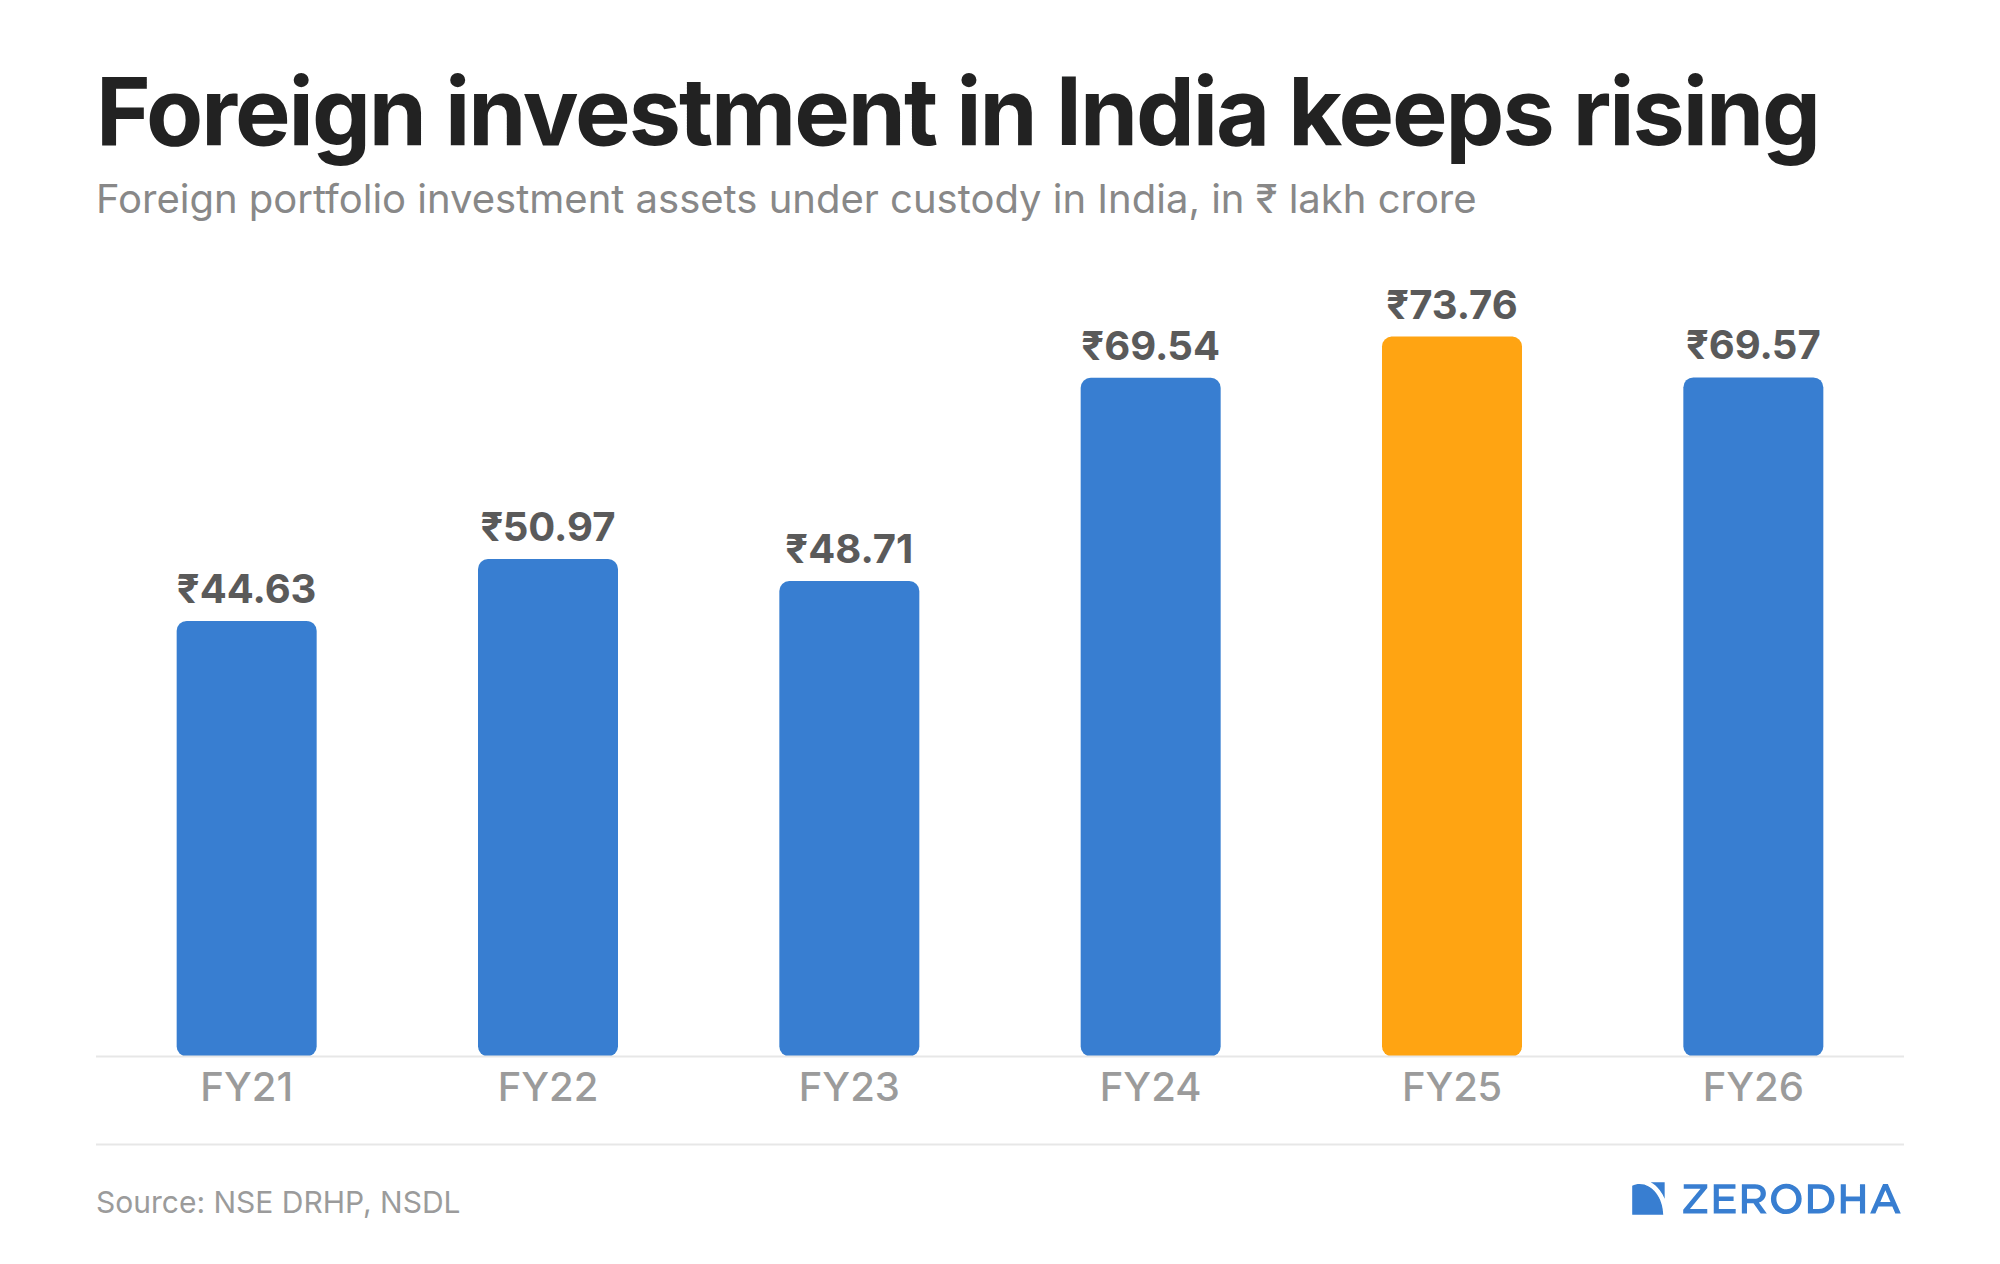
Now, despite all the hoopla about foreign investors fleeing India, falling FII ownership, and the endless headlines about foreign money leaving the country, foreign investors still remain a significant part of Indian capital markets.
If you look at the total assets held in the market, foreign investors continue to account for a substantial share of ownership. While their percentage ownership has declined over time, this is often less a story of foreigners abandoning India and more a story of domestic participation growing much faster
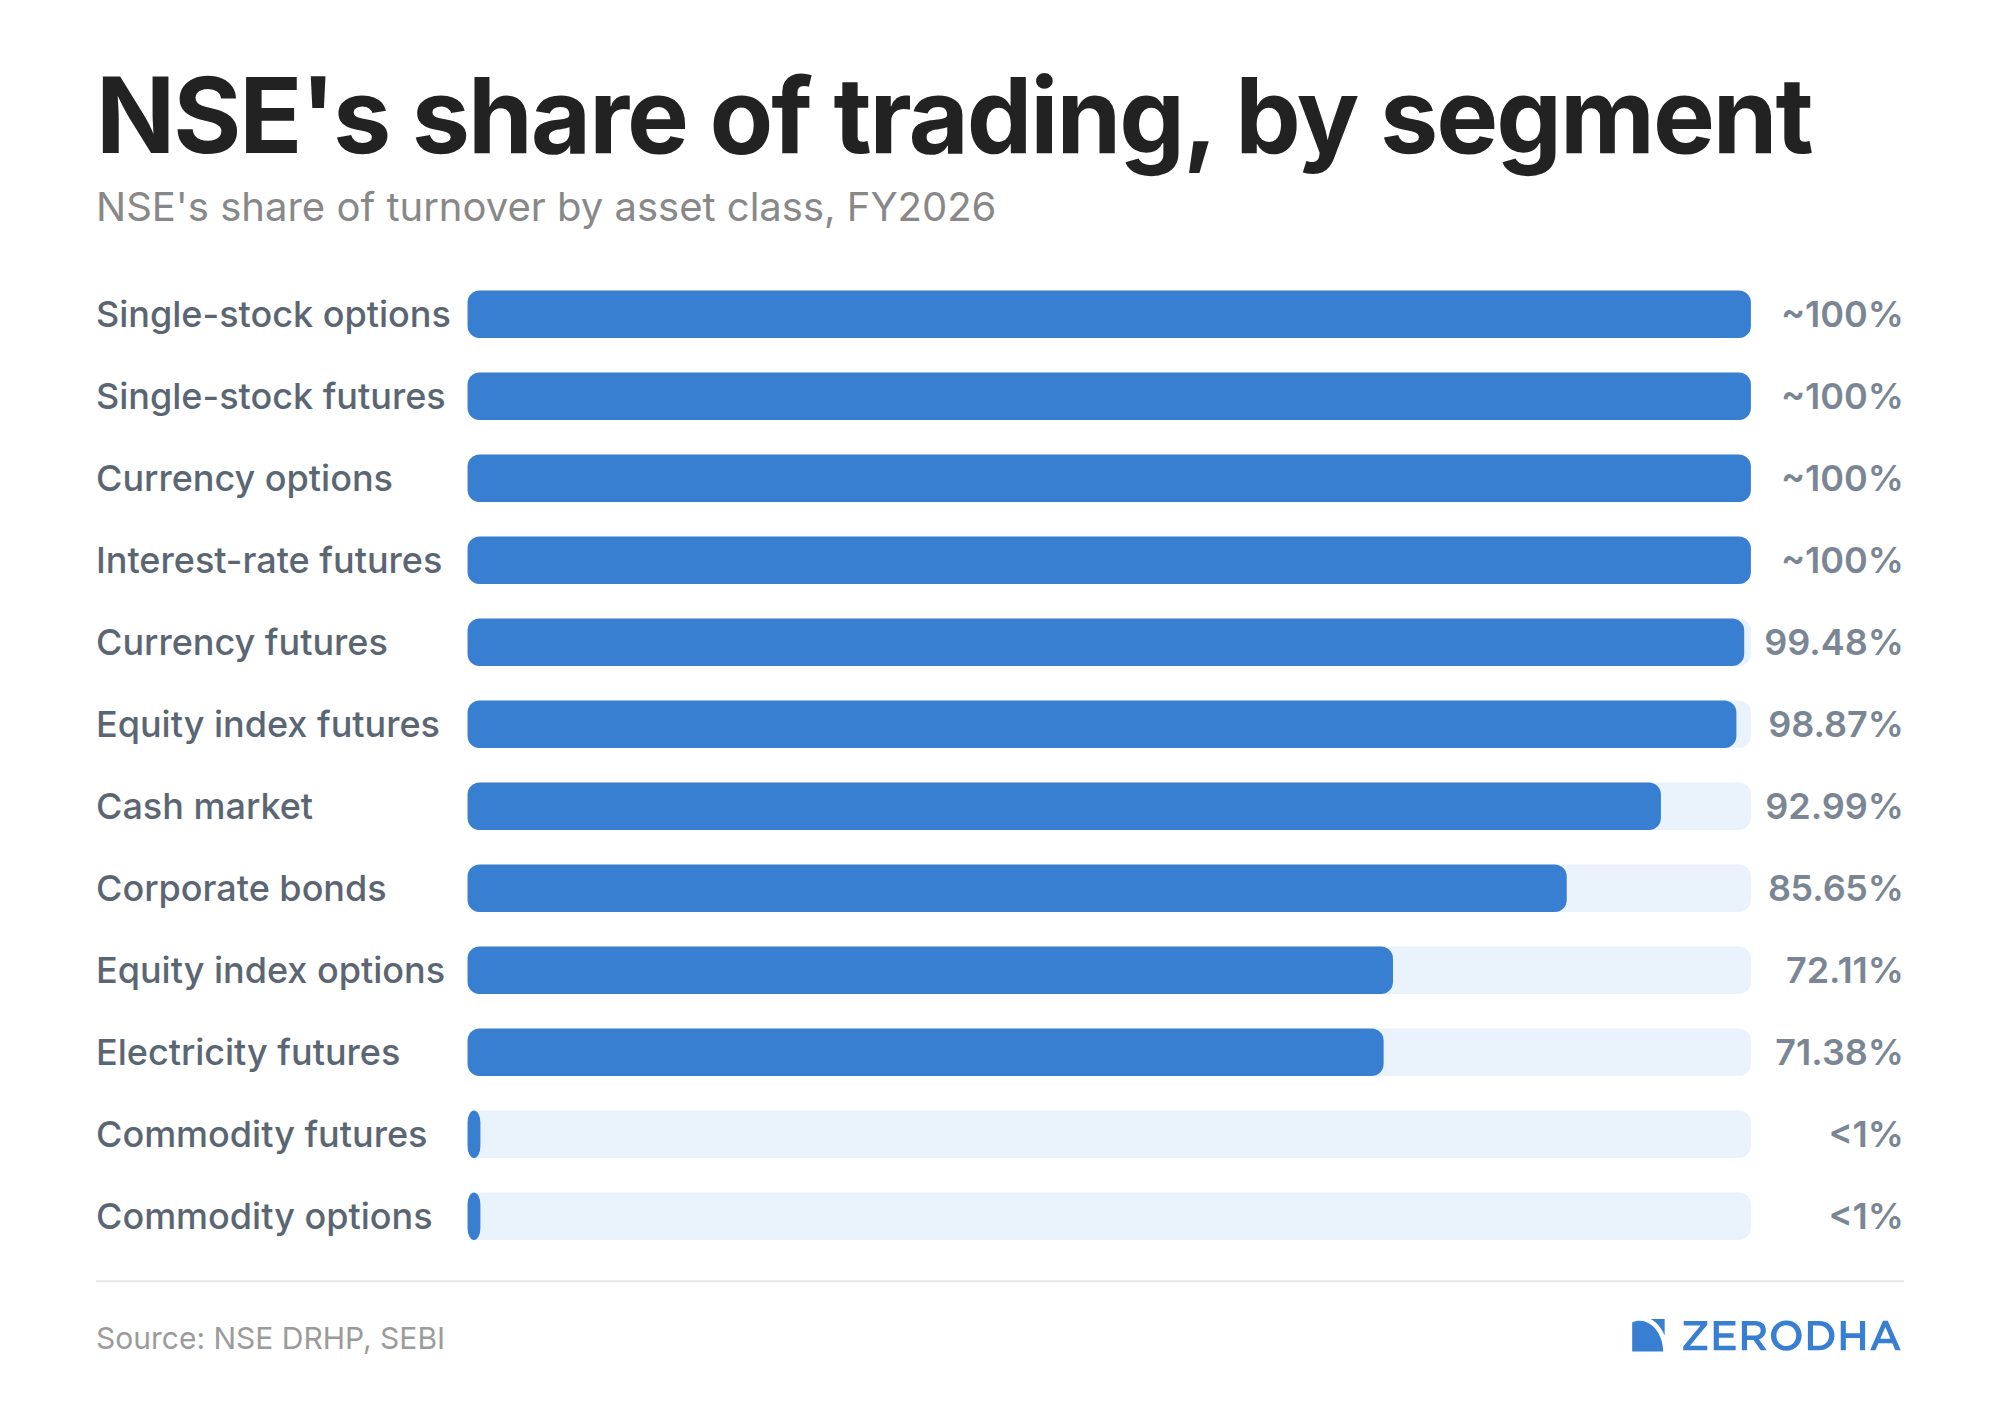
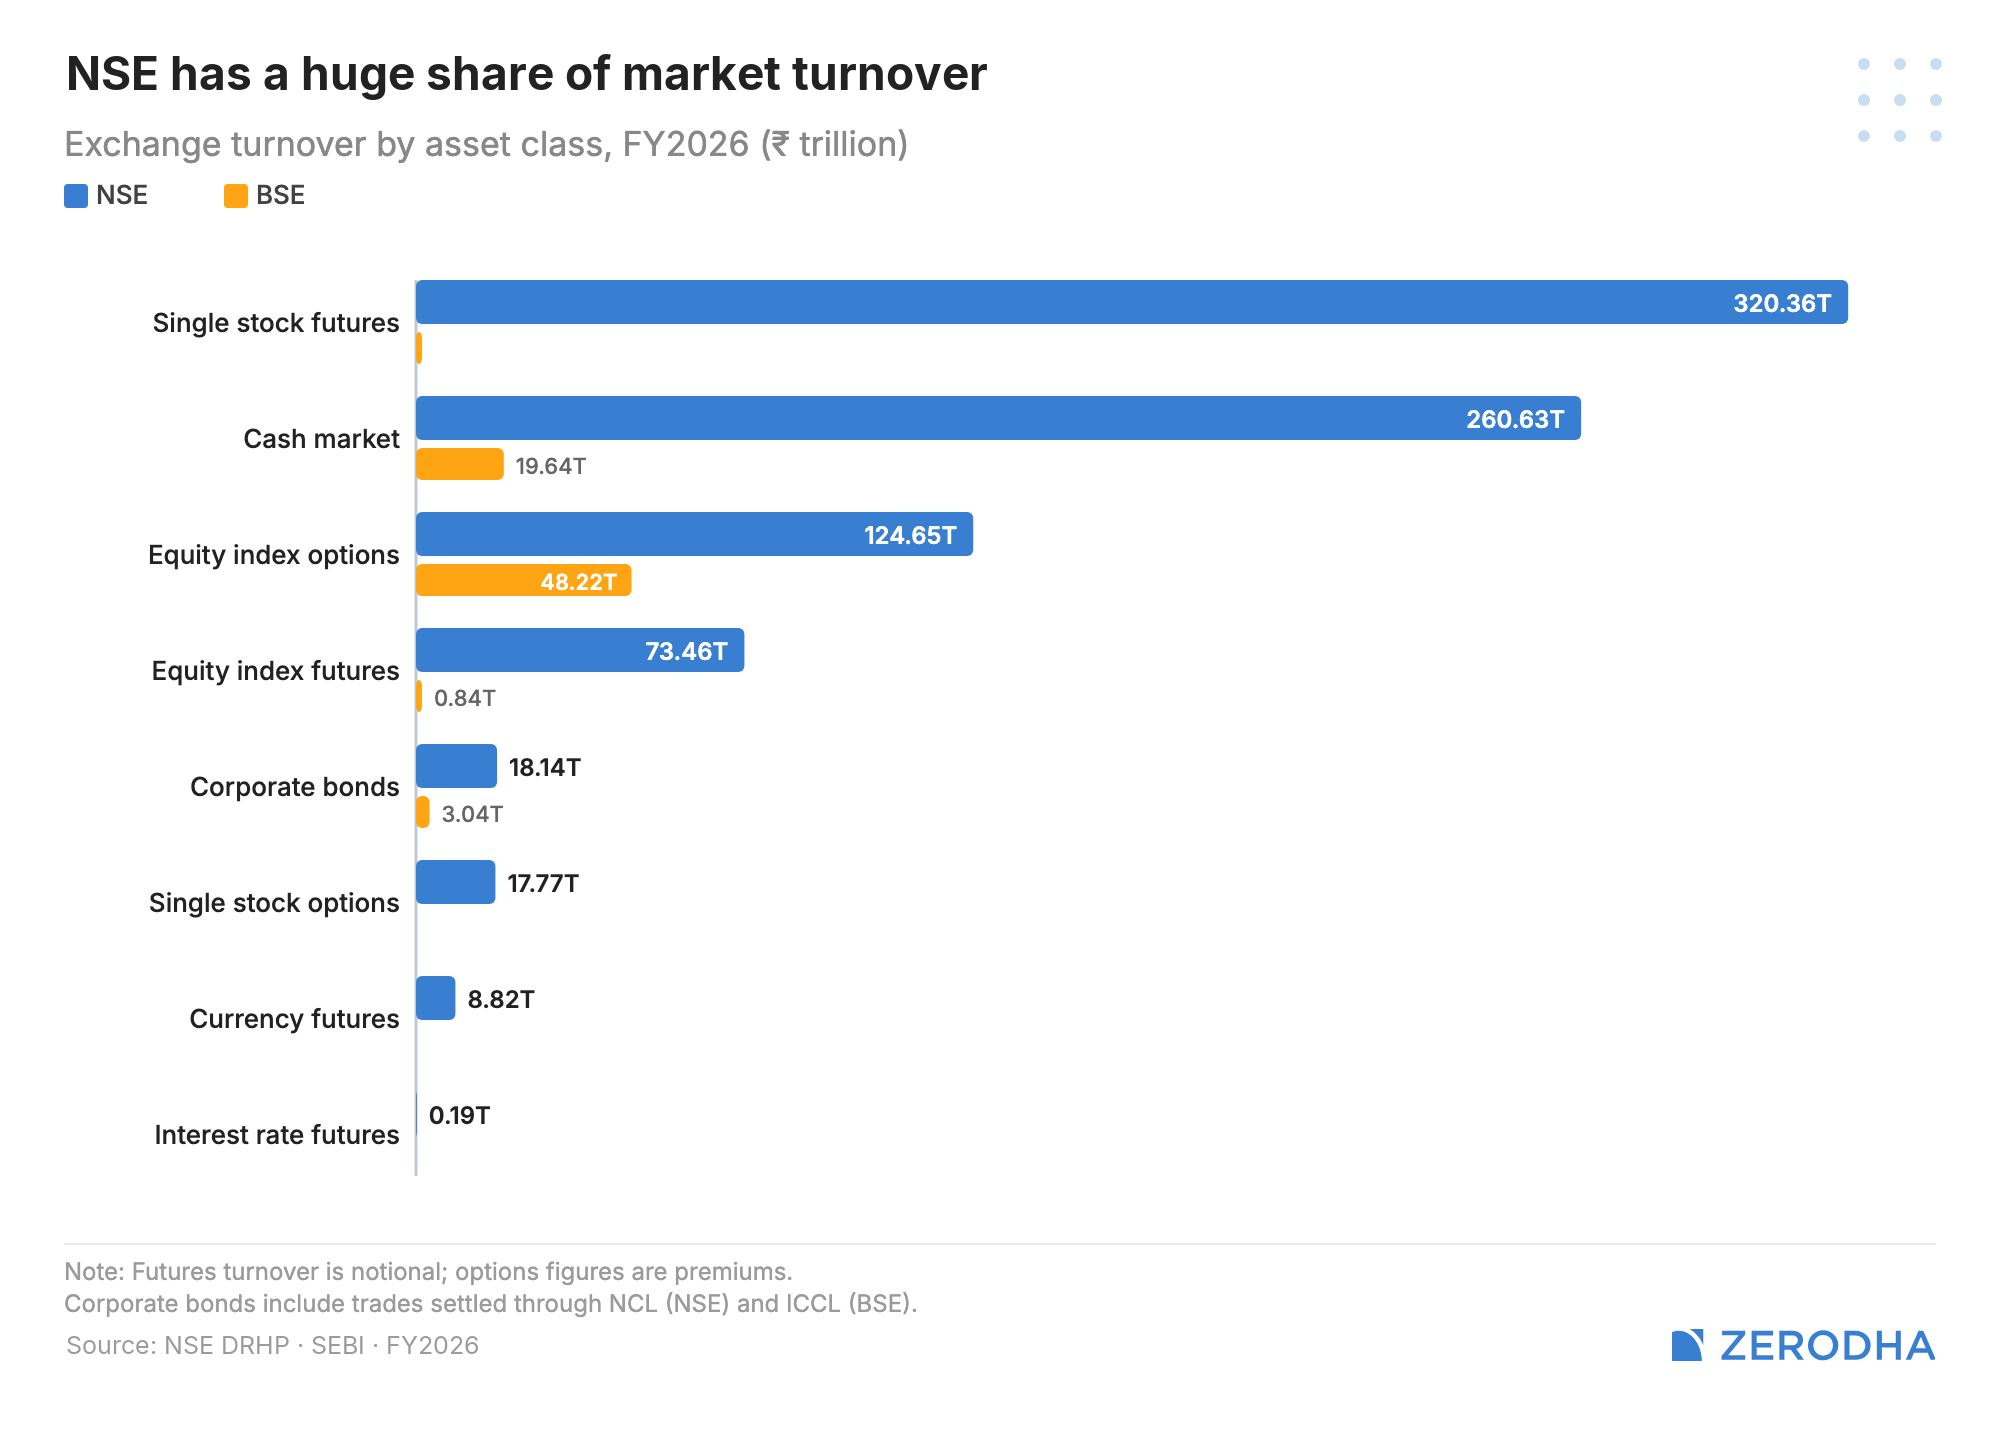
NSE is a near monopoly
NSE is a near monopoly with pretty much close to 100% market share in pretty much all the major segments. Although BSE seems to be catching up in the derivative segment, it’s still very, very early days.
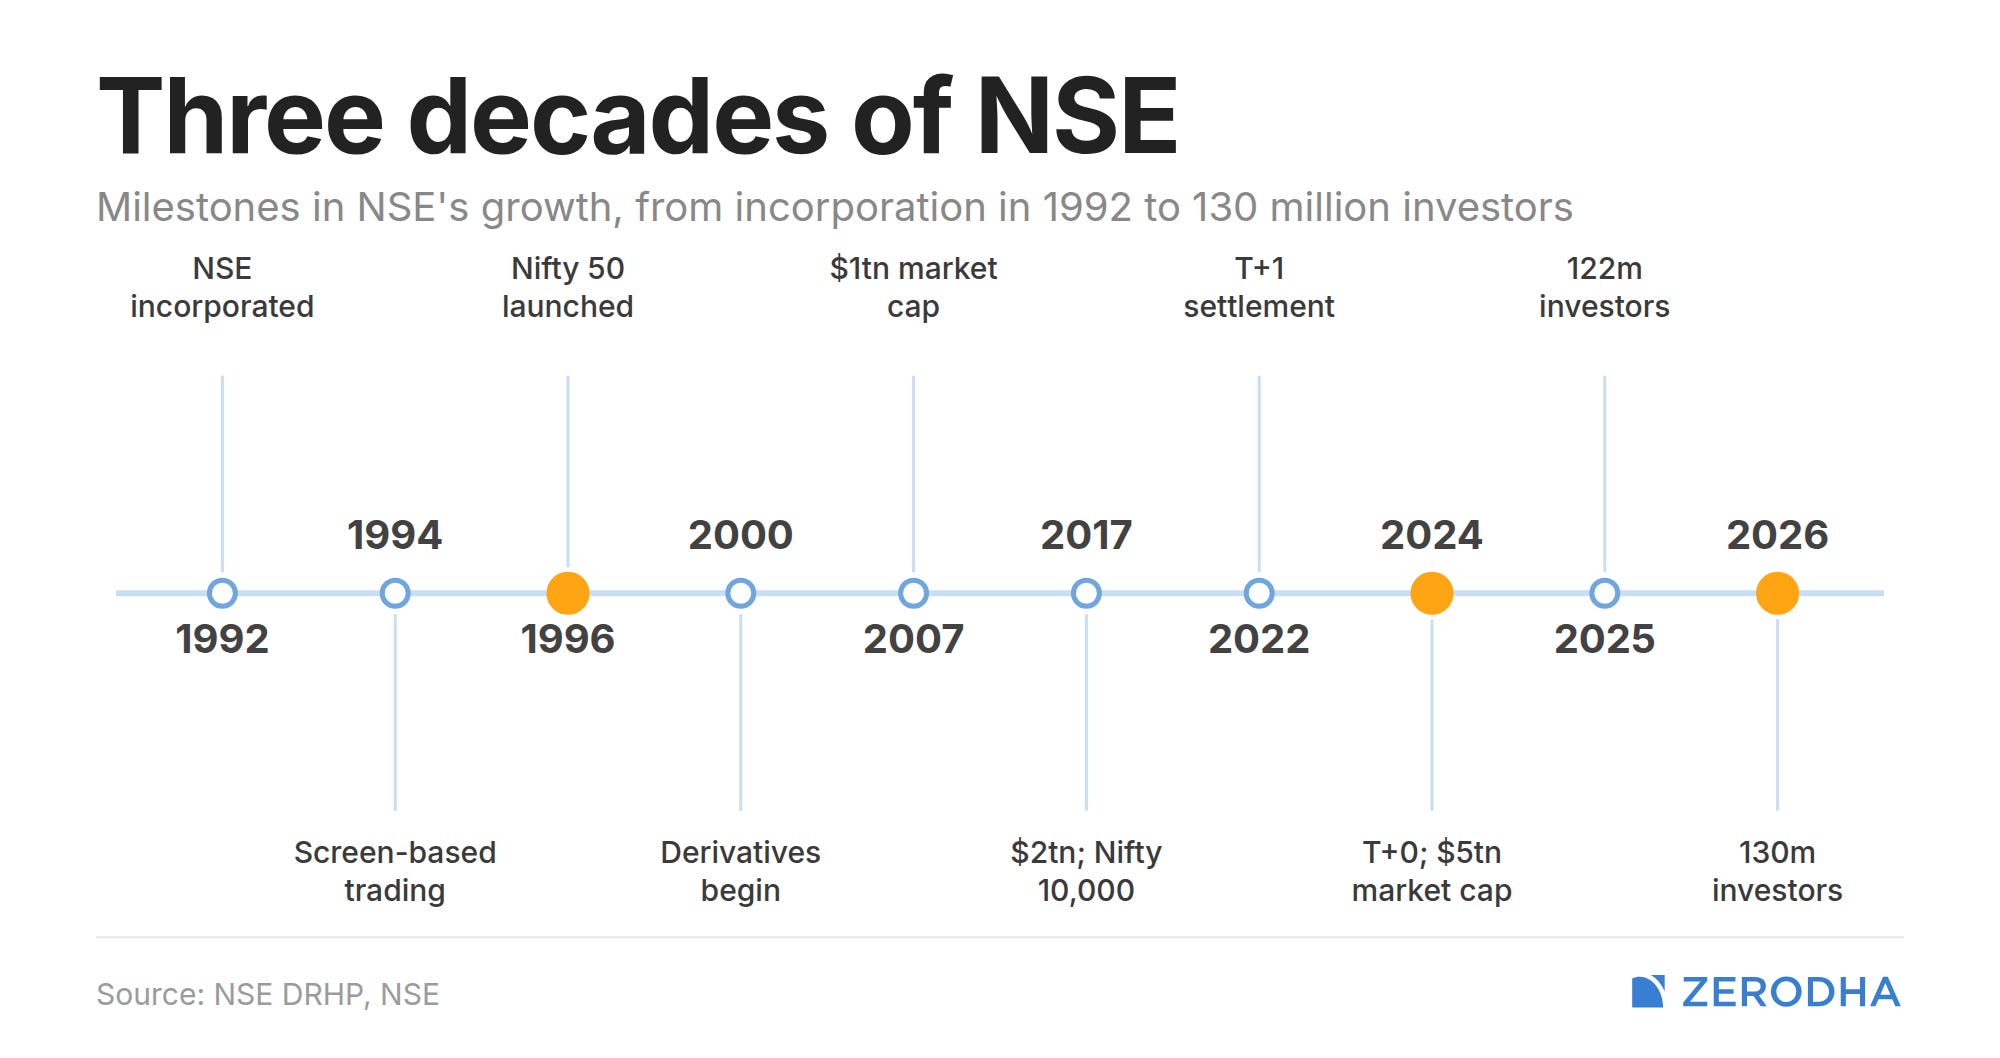
NSE’s journey
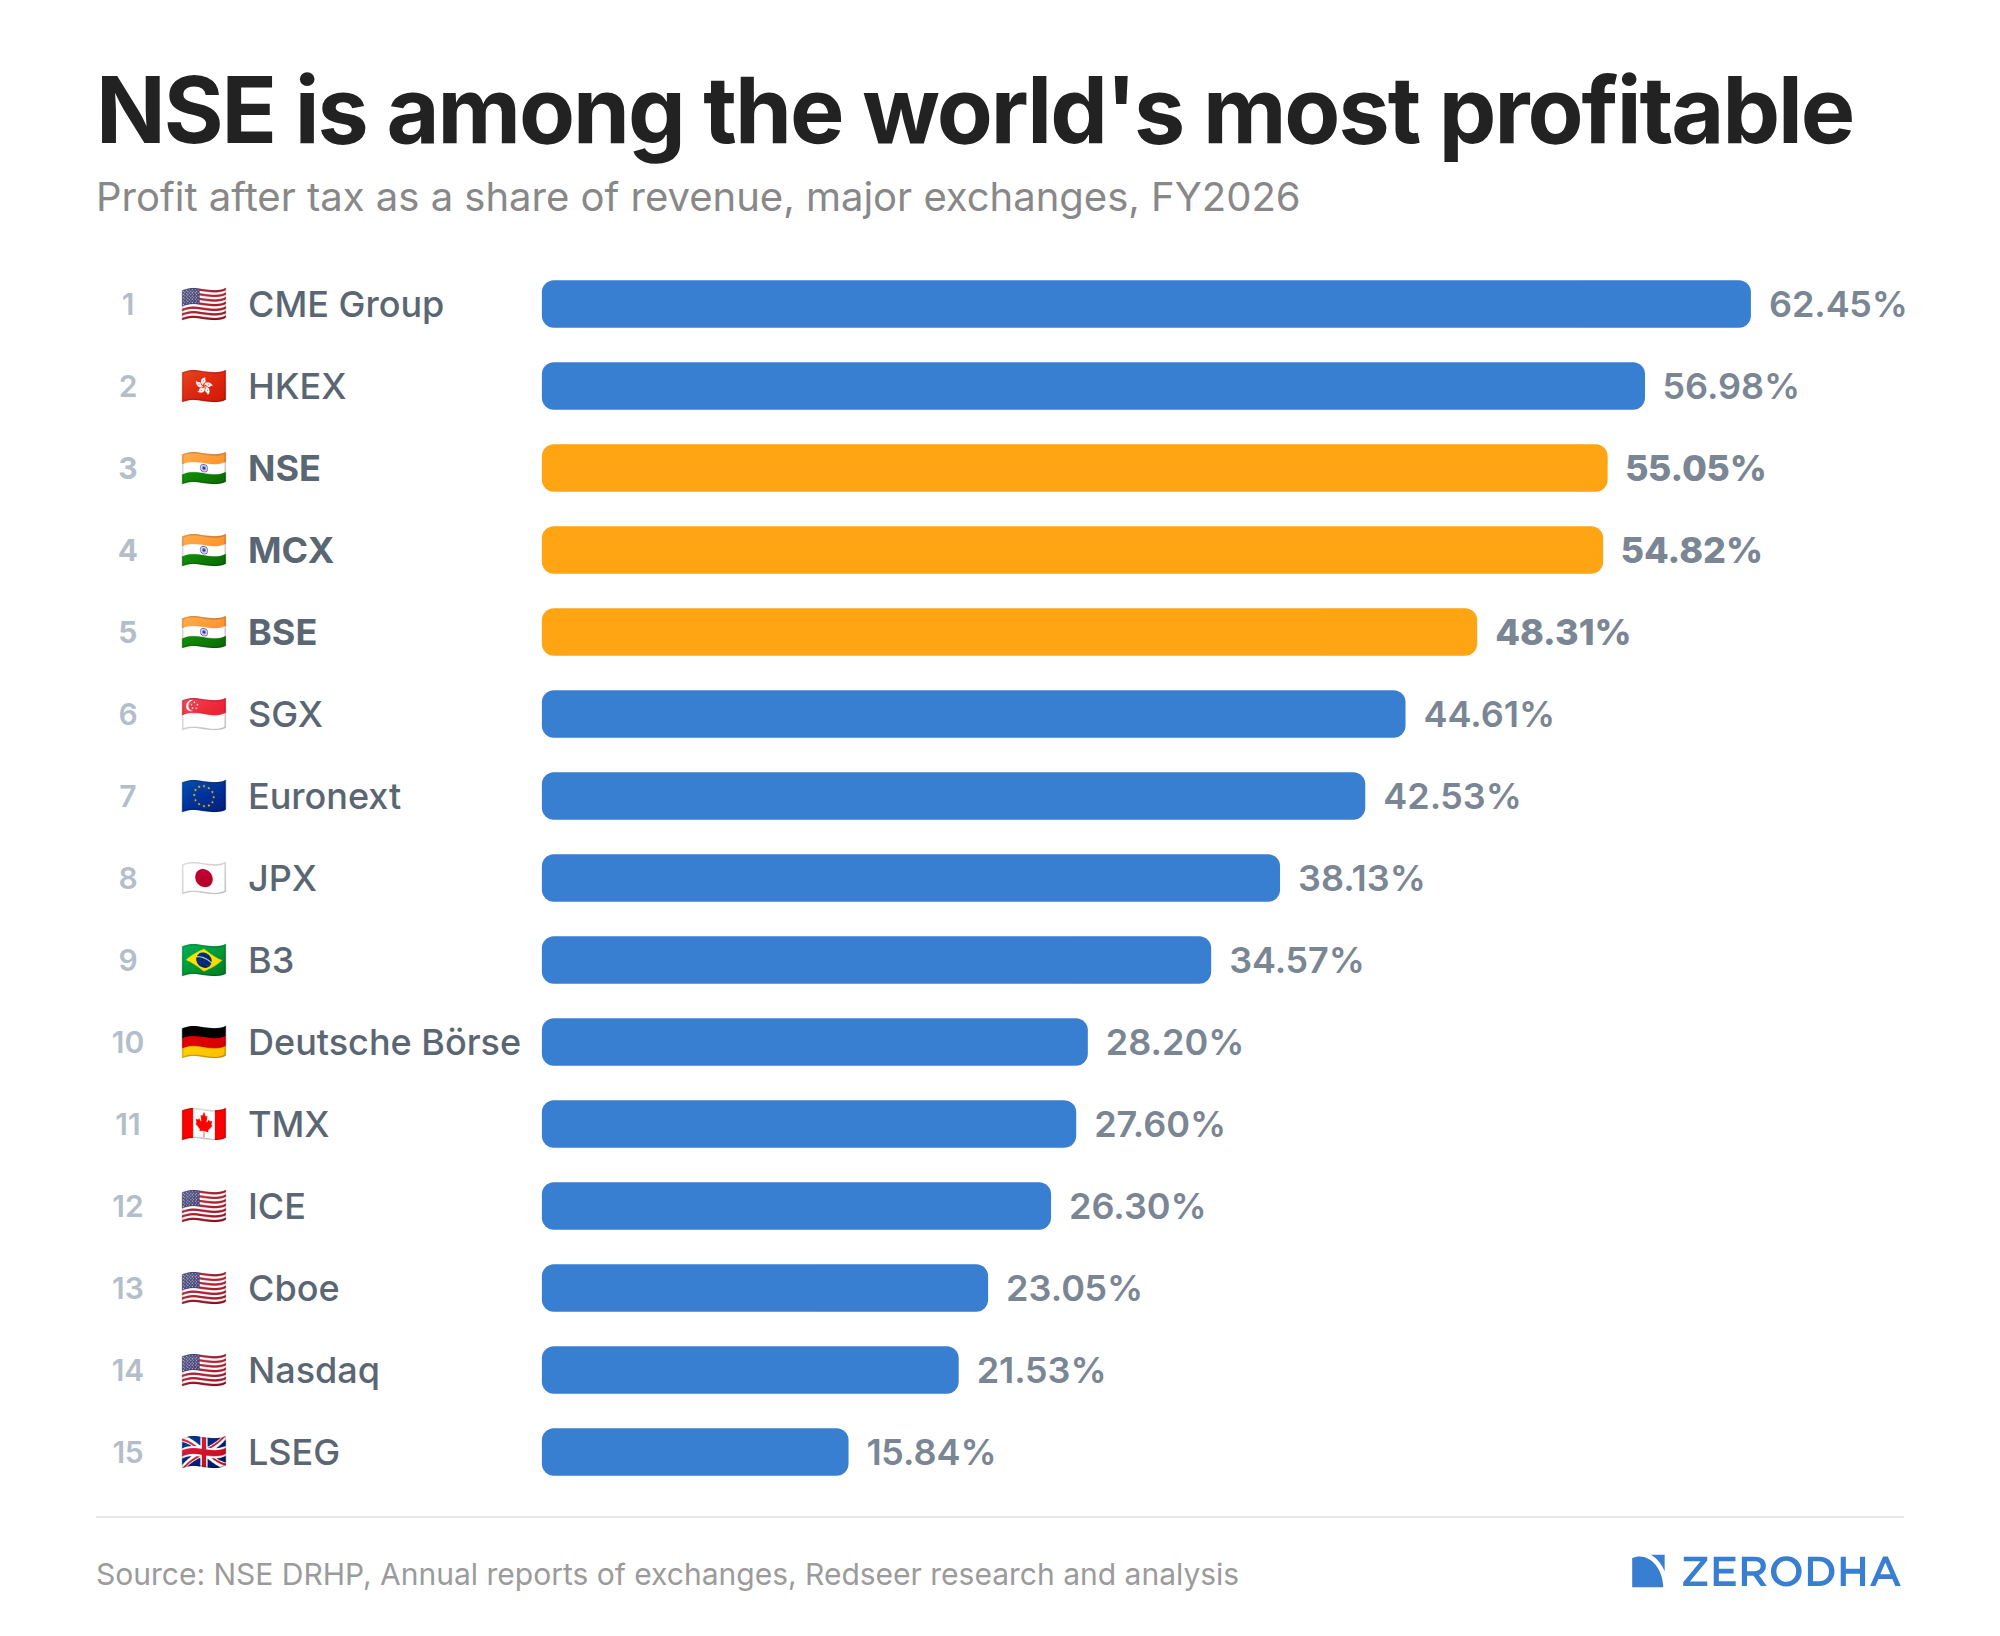
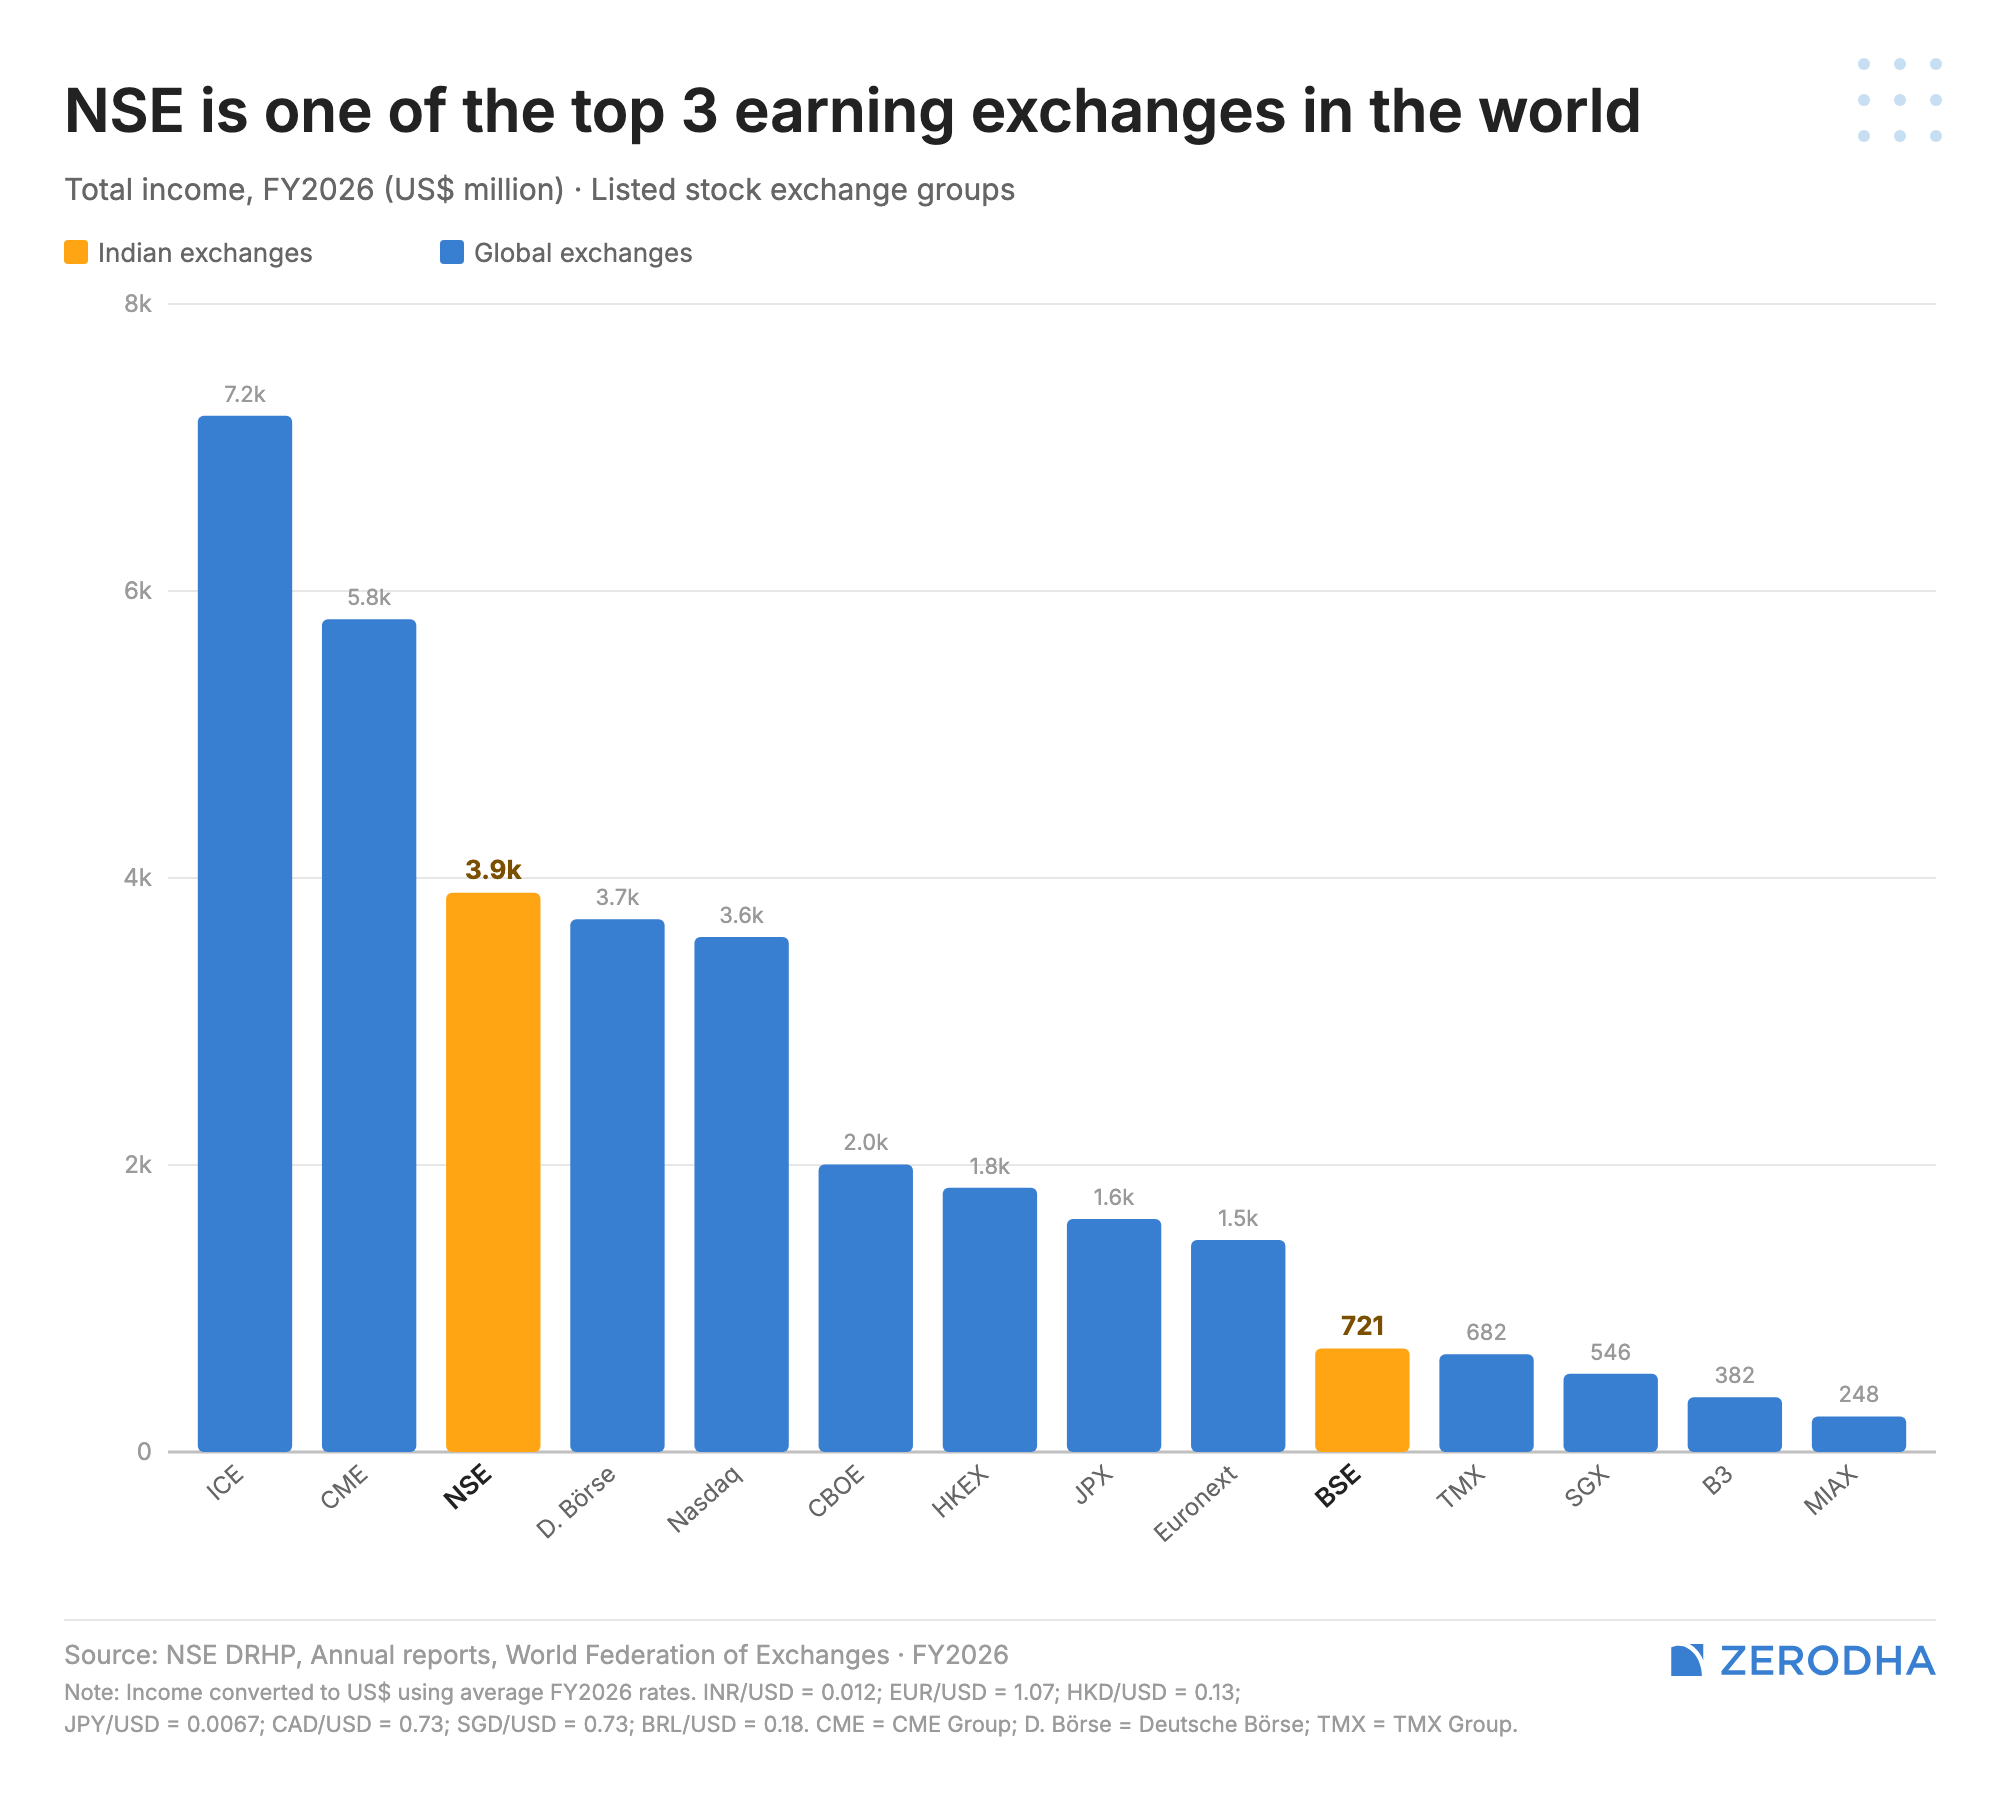
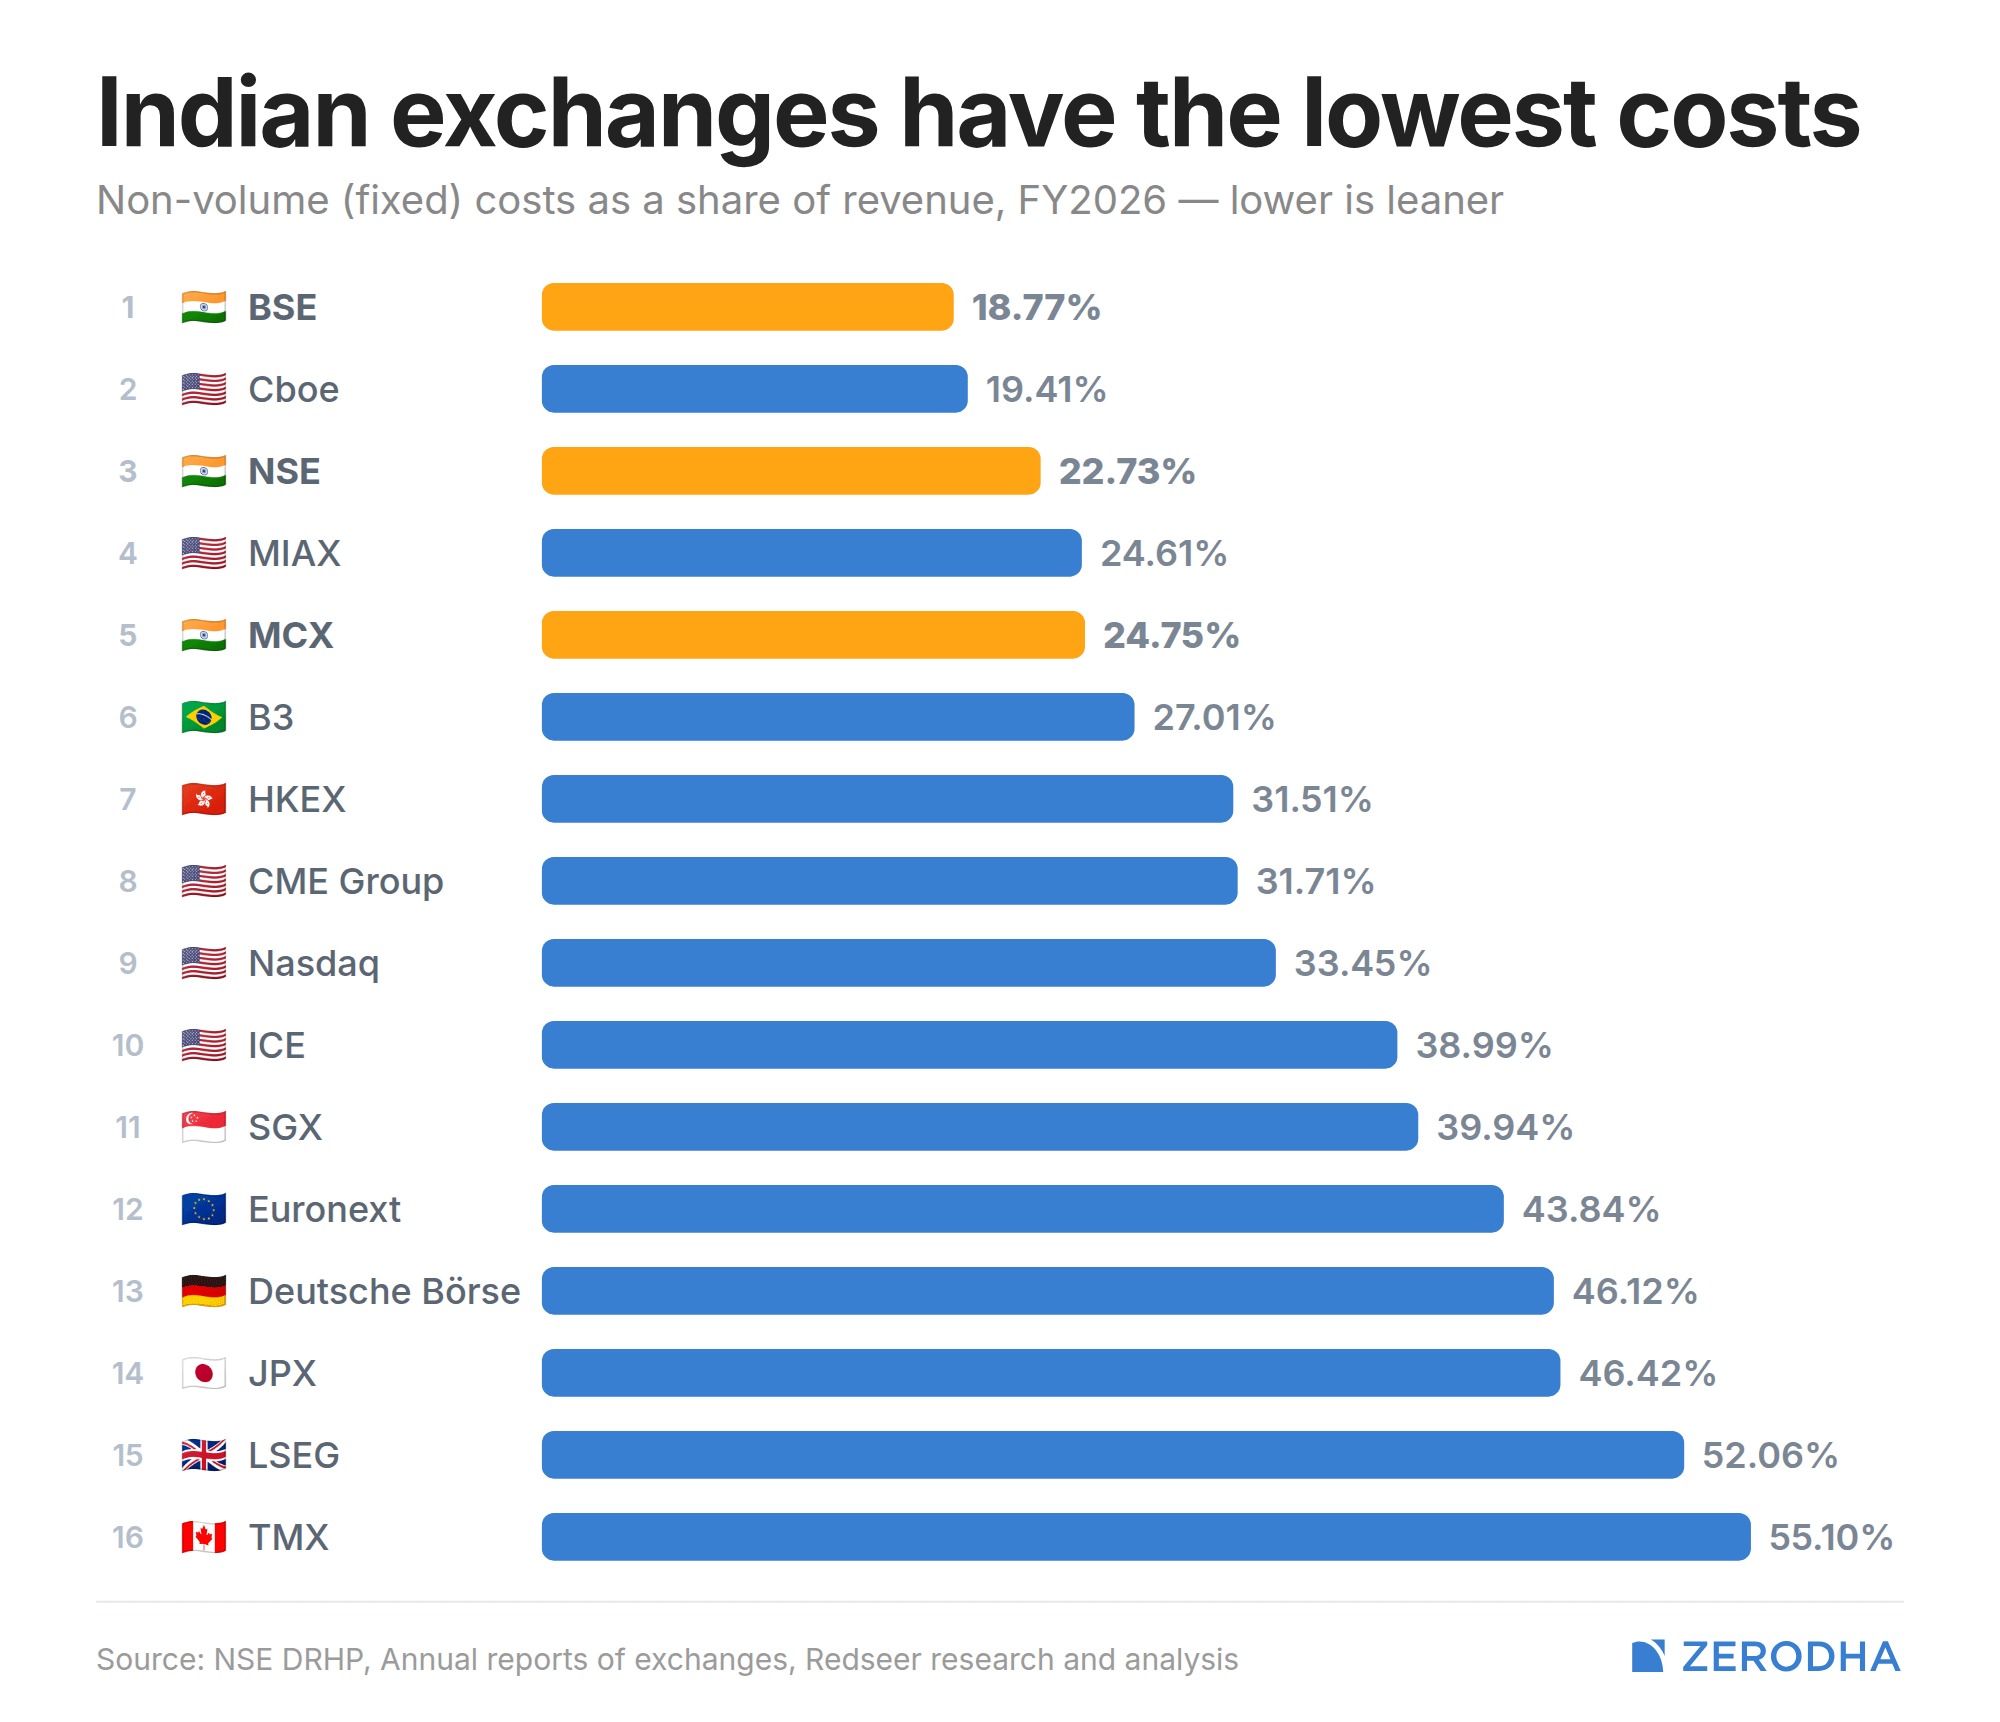
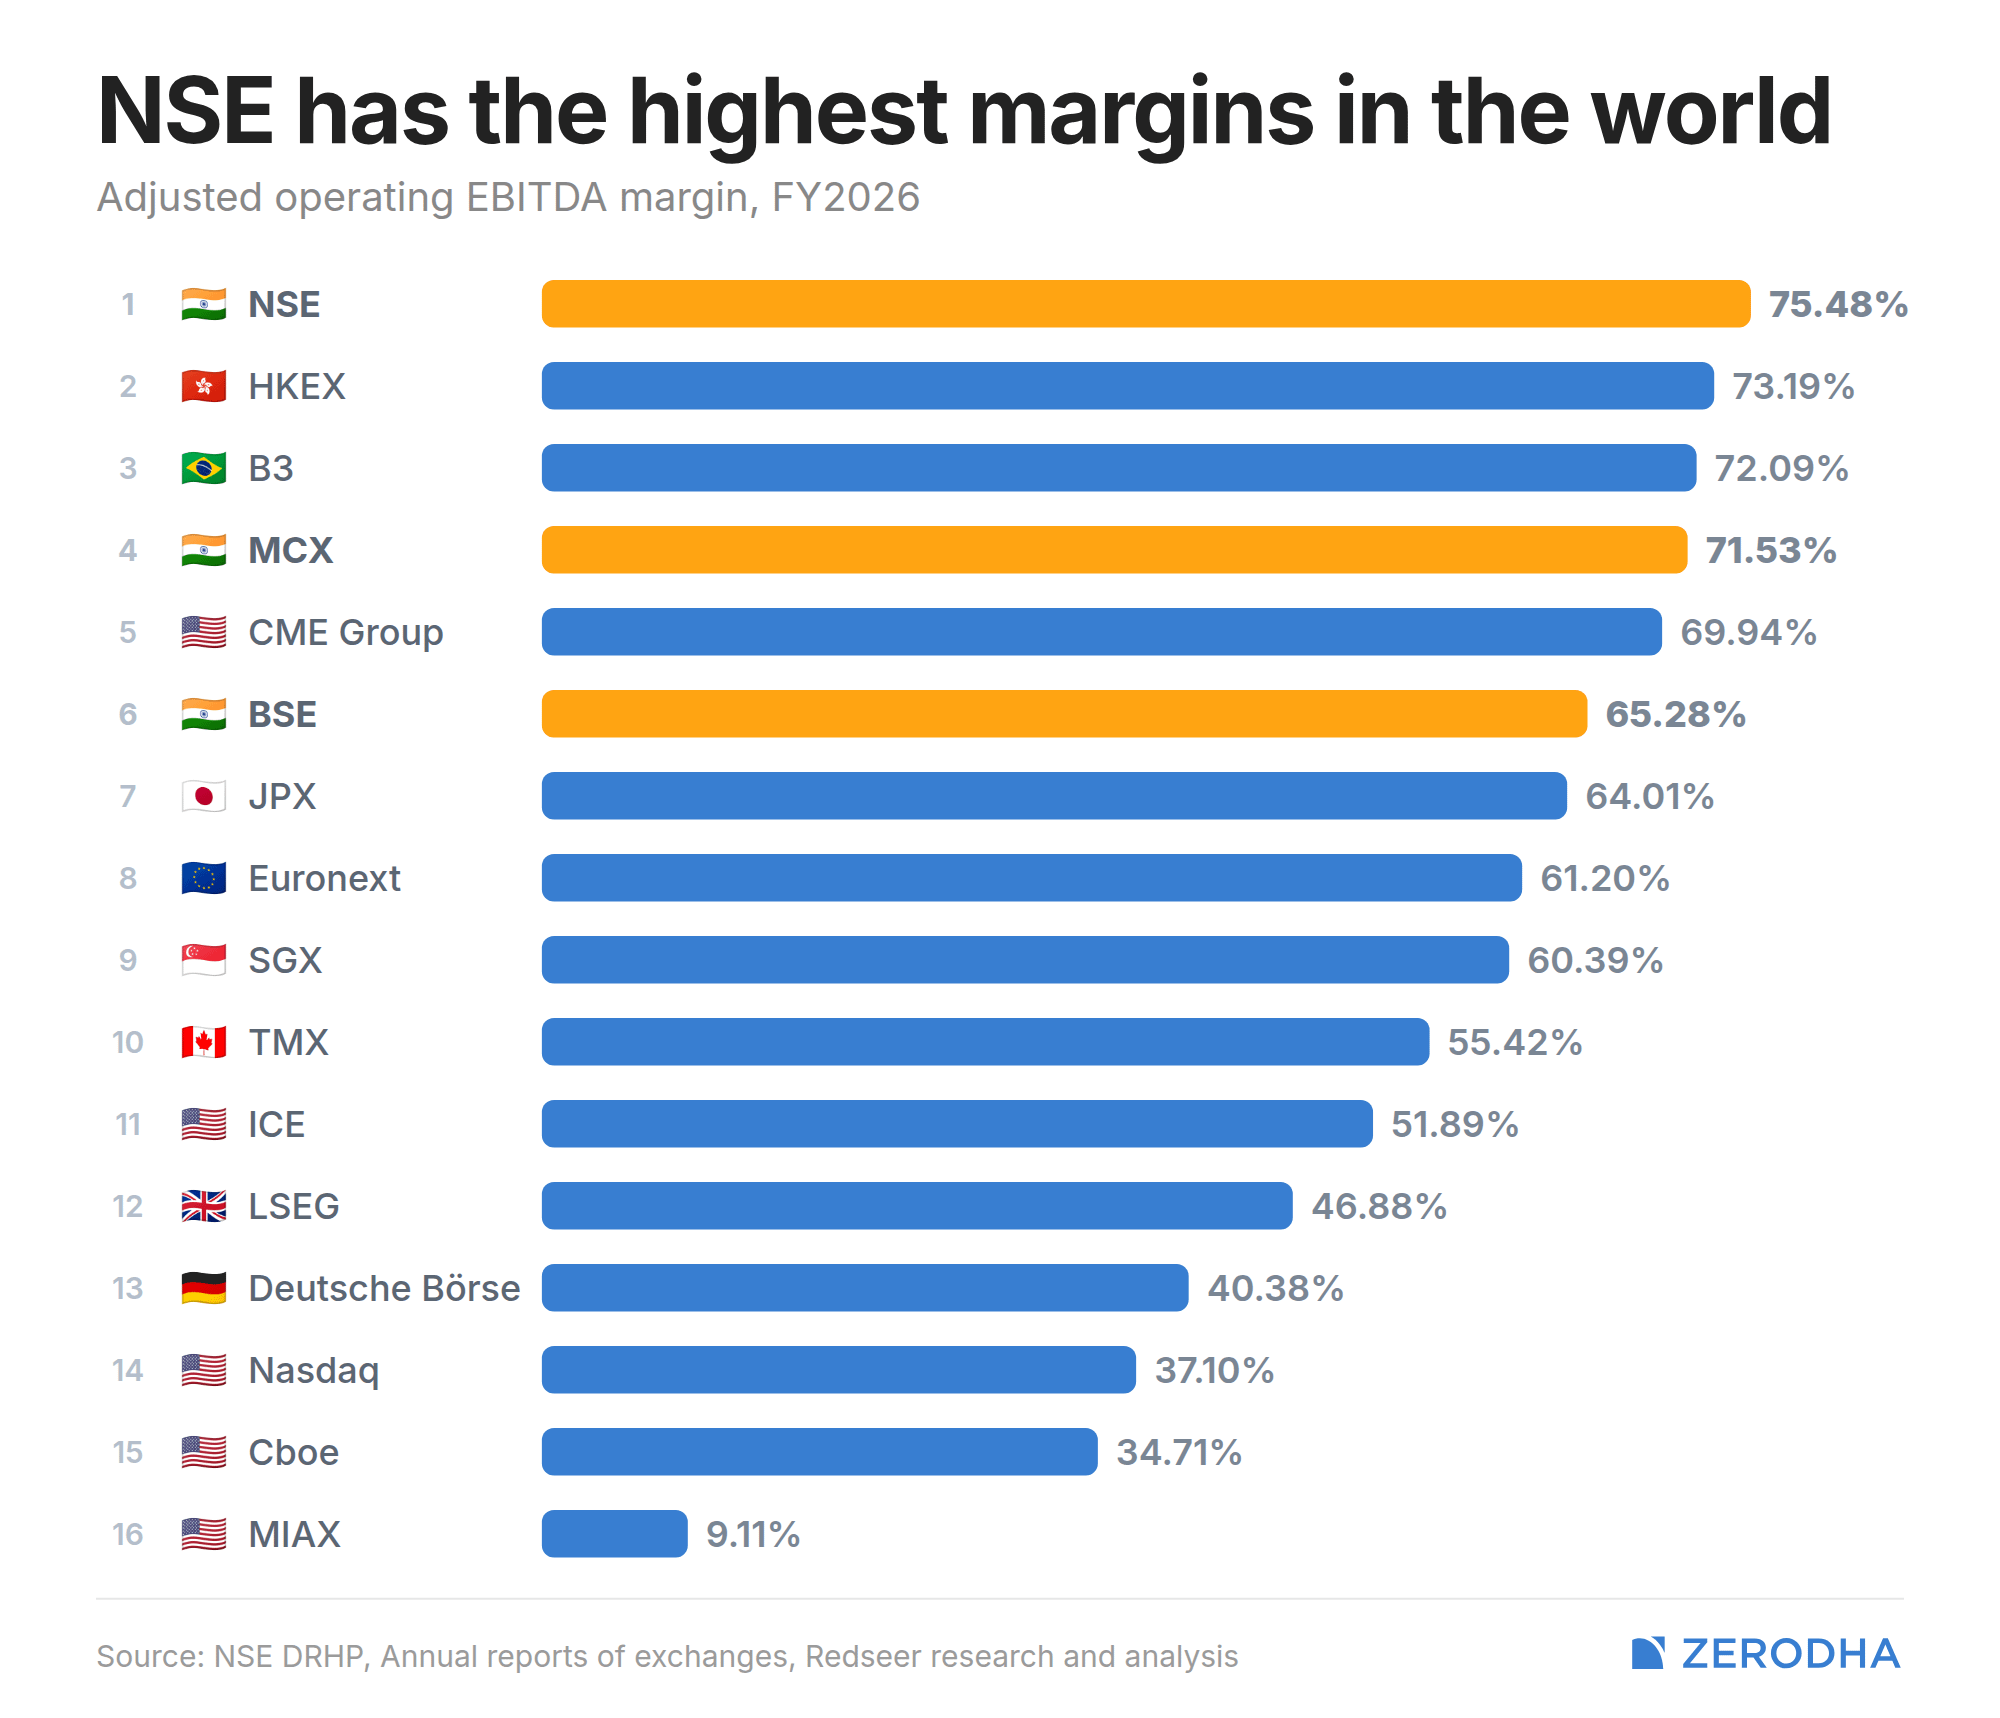
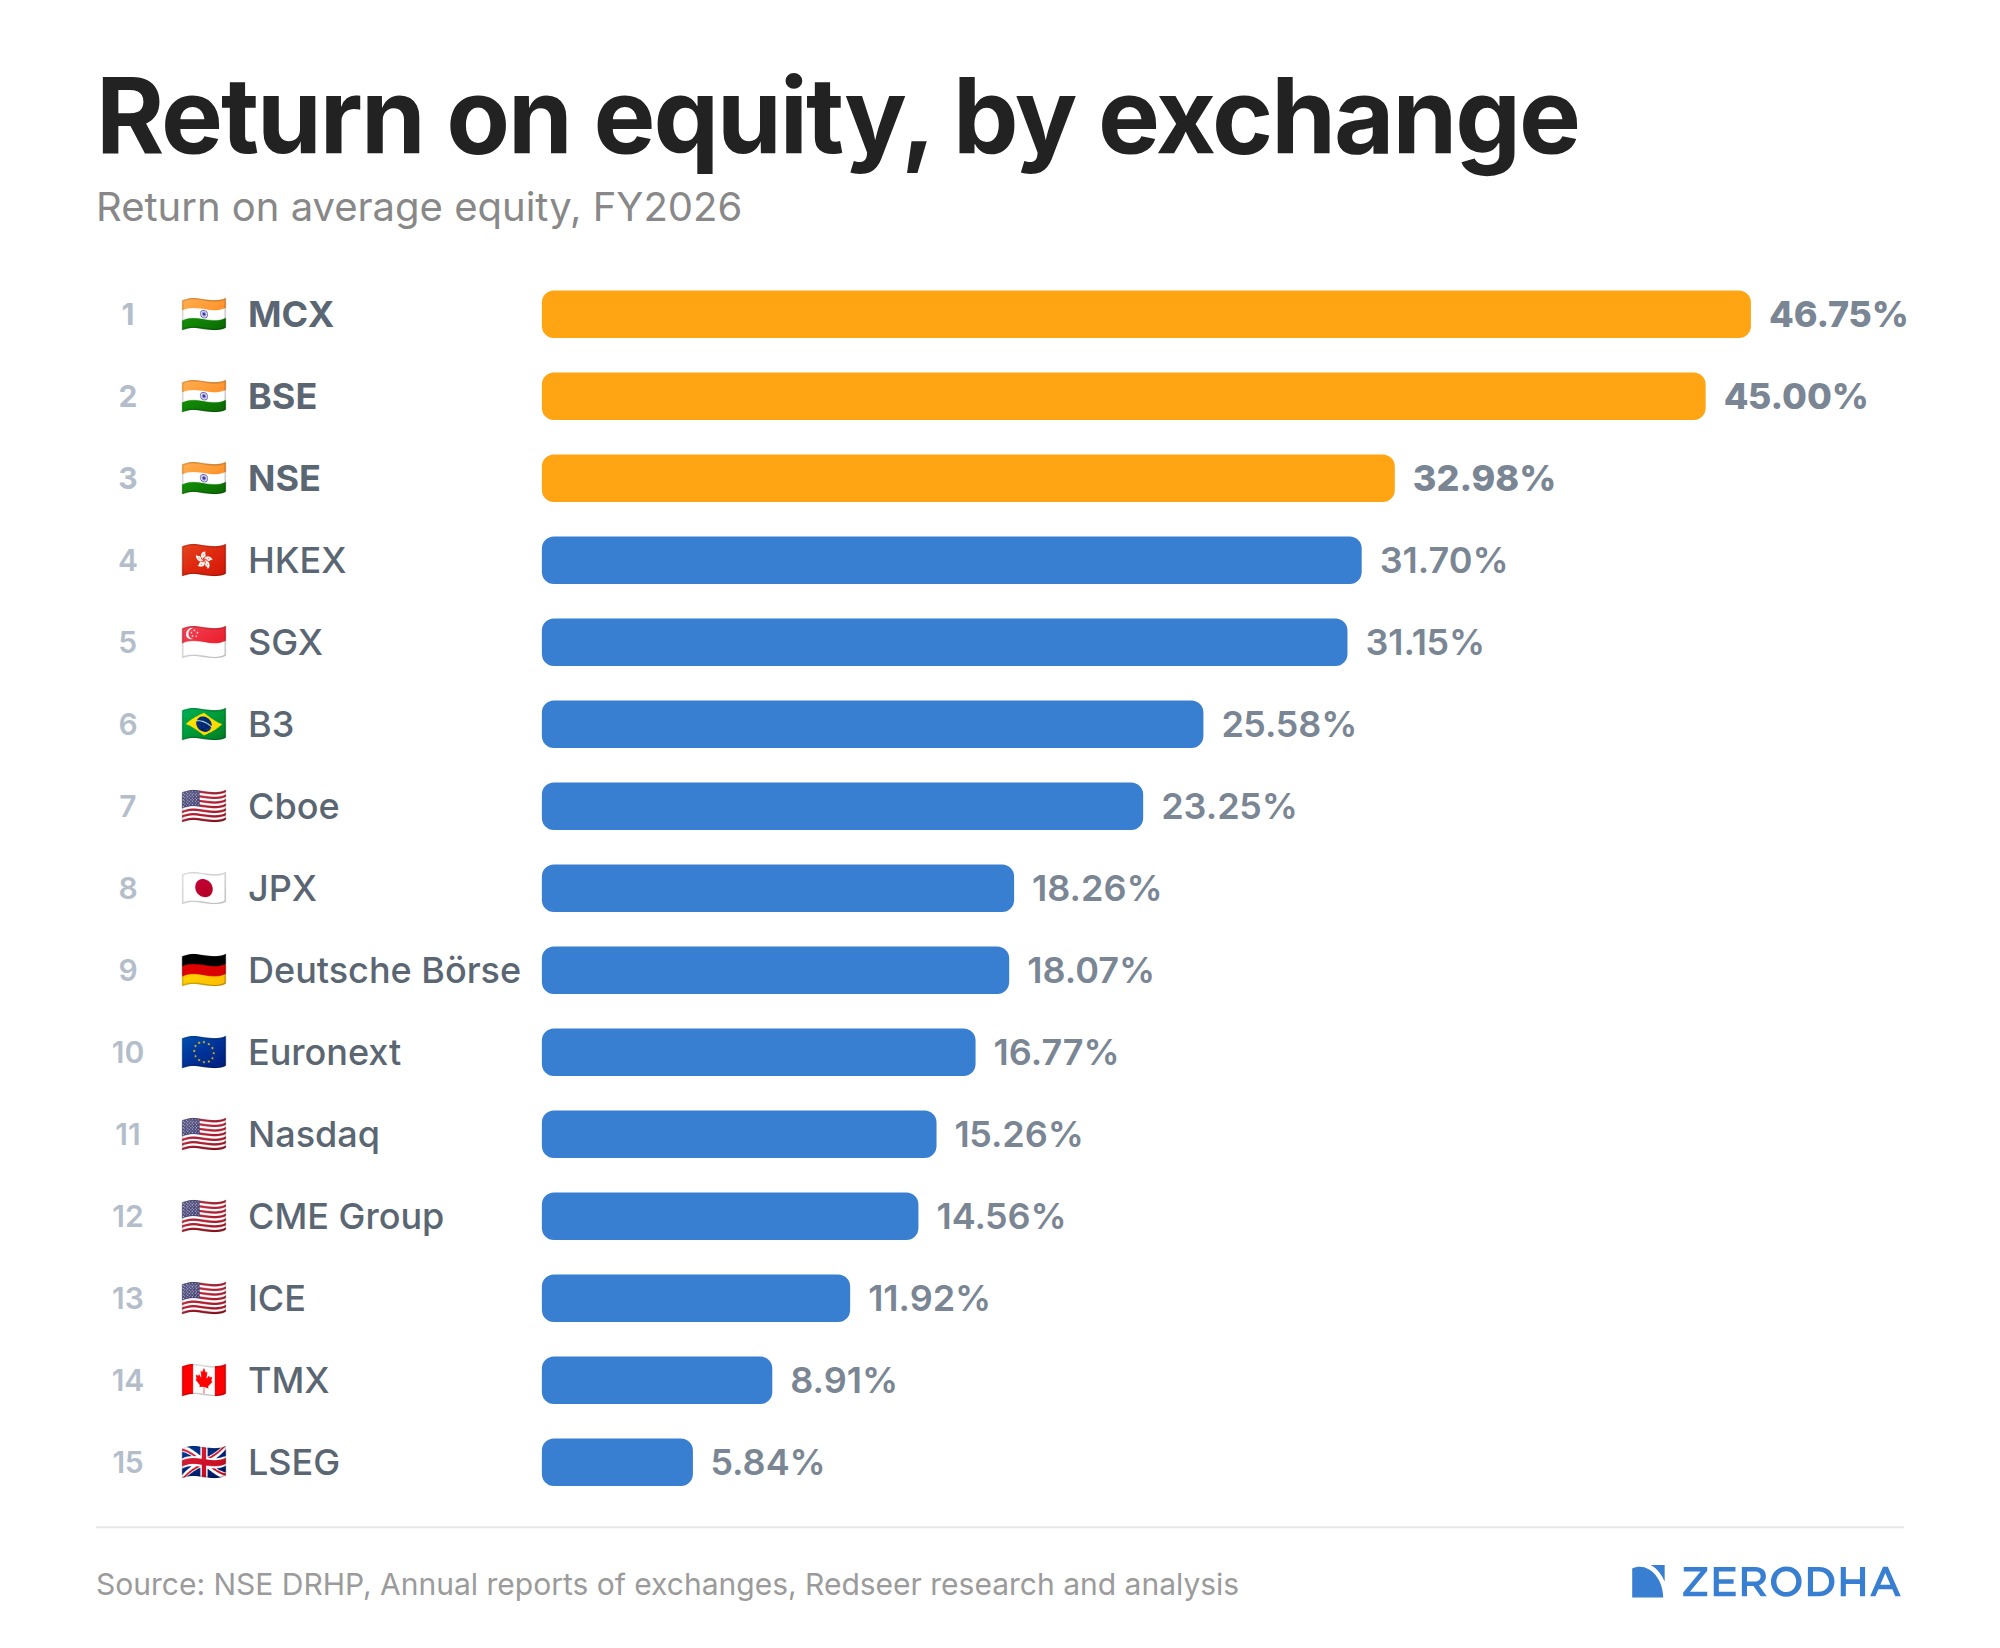
NSE is really profitable
It’s kind of crazy how profitable NSE is, how much money it makes, and how much of it pays out as dividends.


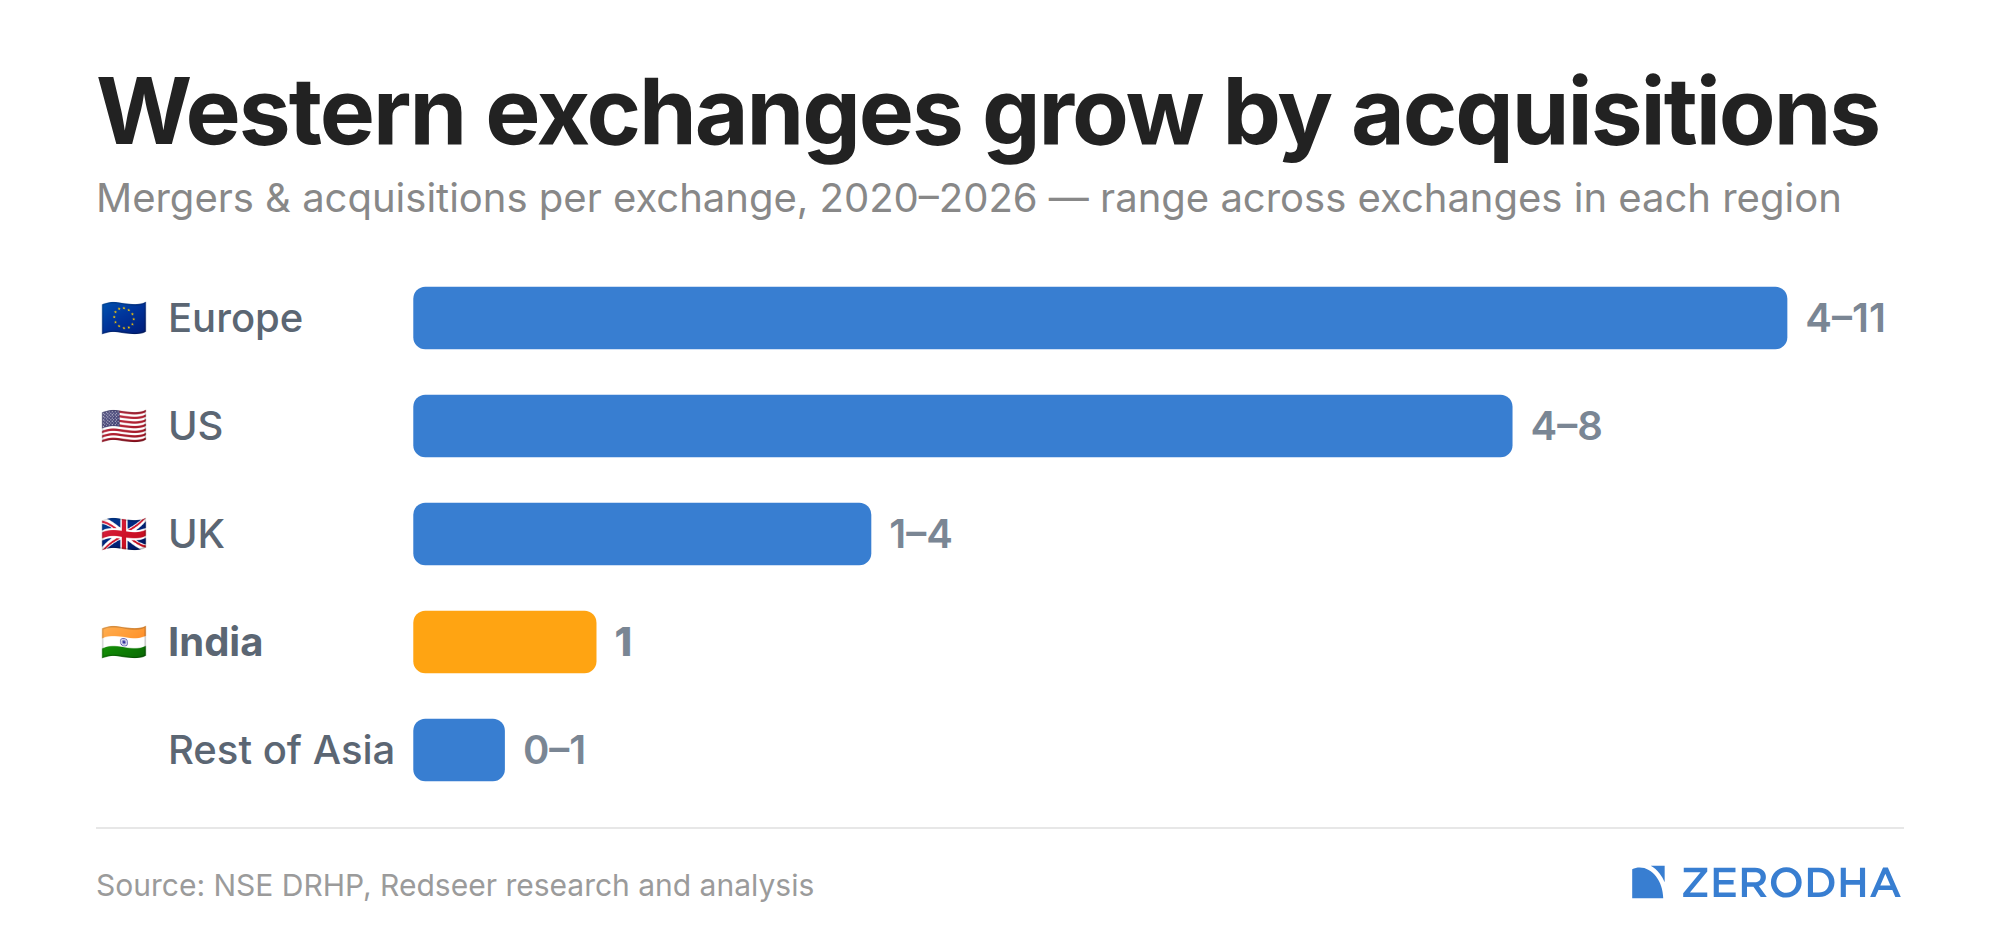
How exchanges grow
This was an interesting data point from the DRHP. It shows how exchanges in the US and Europe have grown over time, and the number of acquisitions undertaken by some of these exchanges is kind of crazy. It speaks to both the maturity of those markets and the sheer number of opportunities available for consolidation.
In contrast, India has a much smaller exchange ecosystem. Broadly speaking, we have four major exchanges: NSE, BSE, MCX, and MSE. I’m not counting exchanges like NCDEX, IEX, and others, but the point still stands.
What’s also interesting is that SEBI has generally not been very keen on allowing exchanges to become larger through acquisitions. As a result, inorganic growth is not really an option for Indian exchanges in the way it has been for their Western counterparts.
That means Indian exchanges largely have to grow the old-fashioned way: by increasing volumes, adding new products, attracting more participants, and deepening the markets they already operate in. Whether that’s a good thing or a bad thing is a separate debate, but it does make the growth trajectory of Indian exchanges very different from what we’ve seen in the US and Europe.
That’s it for the first edition.
I hope you enjoyed what we’ve put together for you. This is a new format for us, and I fully understand that there are rough edges and plenty of things that can be improved.
And that’s where your end of the bargain begins.
Please send us your feedback, ideas, suggestions, criticisms, and anything else you think can help make this publication better. Unlike many people who say this as a ritual and then promptly ignore what follows, we genuinely do read the comments, emails, and messages we receive.
Points & Figures is still a work in progress, and we’d love your help in shaping what it becomes.
So let us know what you liked, what you didn’t, what you’d like to see more of, and what you’d like us to do differently. We’ll read it all and use it to make future editions more useful, more insightful, and hopefully a lot more fun.
Until next time.
Quite interesting and its well presented.