


Hello, welcome to this week’s edition of Points & Figures. This edition is done by Kulsum & Mridula.
The idea behind this newsletter is simple: to tell stories about the Indian economy, financial markets, and investing through data visualisations. The goal isn’t to send you a bunch of random, out-of-context charts, because pretty much everybody does that already.
Instead, we take large datasets that are often overlooked or under-appreciated and use them to tell stories about trends, shifts, and developments in the Indian economy and markets that you might not otherwise come across. And like everything else we do under Markets by Zerodha, the quality bar remains extremely high.
A factory is the only place where capital, labour and production converge at their strongest. Someone has invested in land, buildings and machinery. Workers have been hired. Raw materials have been bought from other businesses. Electricity, fuel and transport are being consumed. At the end of this process, something of far greater value than the sum of all these parts is expected to emerge.
That makes factories useful for examining several questions at once. Is manufacturing creating enough jobs? What kinds of jobs are being created? Is the sector becoming more dependent on machinery? And is all this investment actually helping factories create more value?
Unlike China, South Korea or Japan, India became a major services economy before it could build a comparably large manufacturing base. Services can generate high-value jobs and enormous economic value, but historically, they’ve not been as effective at absorbing large amounts of labor as manufacturing. So, if we want to know whether India is building a deeper industrial base, its factories are a useful place to look. But there is a complication: the data in this story do not describe every manufacturing unit in India.
What exactly does the ASI measure?
India has a large world of household units, tiny food processors, garment workshops, furniture makers and other small enterprises outside the registered factory system. The Annual Survey of Industries, or ASI, mainly covers the registered or organised factory sector. The unincorporated part of manufacturing is measured separately through surveys such as the Annual Survey of Unincorporated Sector Enterprises.
This distinction is important. The ASI can tell us a great deal about the capital, jobs, output and value created inside registered factories. It cannot, by itself, describe all of Indian manufacturing, most of which is still unorganized.
The ASI’s frame is built mainly from lists of registered factories maintained by state authorities. It covers factories registered under the Factories Act, along with certain bidi and cigar units, electricity undertakings and some other eligible establishments. Some categories, such as defence establishments, railway workshops, government mints, restaurants and oil storage depots, are outside its scope.
The word “factory” also has a legal threshold. Historically, the Factories Act covered units using power with at least 10 workers and units not using power with at least 20 workers. However, several states have amended those thresholds for themselves. For eight states, the 2023–24 ASI notes thresholds of 20 workers with power and 40 without power. This means coverage is not perfectly uniform across the country, and changes in the survey frame can affect comparisons over time.
The ASI does not visit every unit in the same way. It fully enumerates large factories and certain other categories, while drawing a representative sample from the remaining smaller units. In 2023–24, 63,981 units belonged to the census sector and 19,639 sampled units were selected from the sample sector. The responses are then weighted to estimate the wider registered factory universe.
So the national figures that follow are estimates, not a simple count of every factory return.
How many factories were actually operating?
The ASI estimated that India had about 2.13 lakh factories in operation in 2023–24. But “in operation” is more specific than “on the register”.
You see, the survey frame also contains units that have fixed assets but are not producing. Some of them maintain staff, and some do not. These units can remain in the frame in case they restart, but they are not counted as factories in operation for that year. In other words, the 2.13 lakh figure refers to factories functioning during their relevant accounting year, not every unit listed in the ASI frame.
Of these operating factories, roughly 1.97 lakh were in manufacturing — the core goods-producing part of the factory sector. The remainder came from the other activities covered by ASI, such as certain electricity and bidi units.
Where these factories operate has also changed. In 2001, rural areas accounted for about 35% of operating factories. By 2023, that share had risen to 44%, while the urban share declined from roughly 65% to 56%.
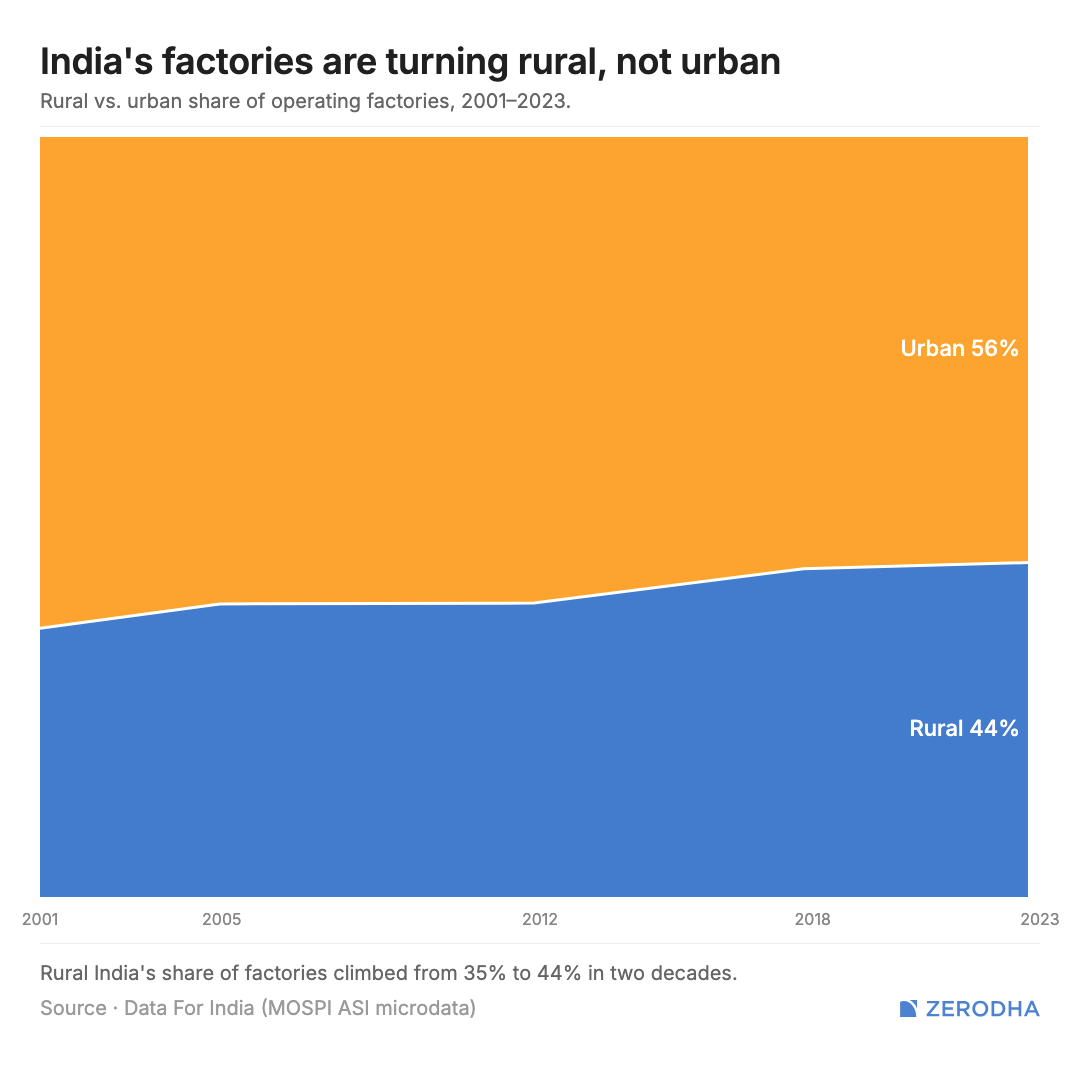
This does not mean rural India now produces 44% of factory output or employs 44% of factory workers; the chart counts factories, not their economic weight. A small food-processing unit and a giant urban refinery each count as one factory. Still, it suggests that the registered factory base has gradually spread beyond cities, potentially bringing industrial activity closer to workers, raw materials and smaller towns.
The number and location of factories tell us the breadth of the system. They do not tell us how economically important each factory is. For that, we need to look at what they produce.
What are India’s factories producing?
The ASI assigns each factory a principal industry under the National Industrial Classification, or NIC-2008, based on its main activity. It then places a rupee value on the factory’s output.
In 2023–24, the registered factory sector produced output worth about ₹153 lakh crore. Basic metals accounted for the largest share, at 14.5%, followed by food products at 13.2% and coke and refined petroleum products at 12.2%. Motor vehicles and chemicals were also among the largest industries by output.
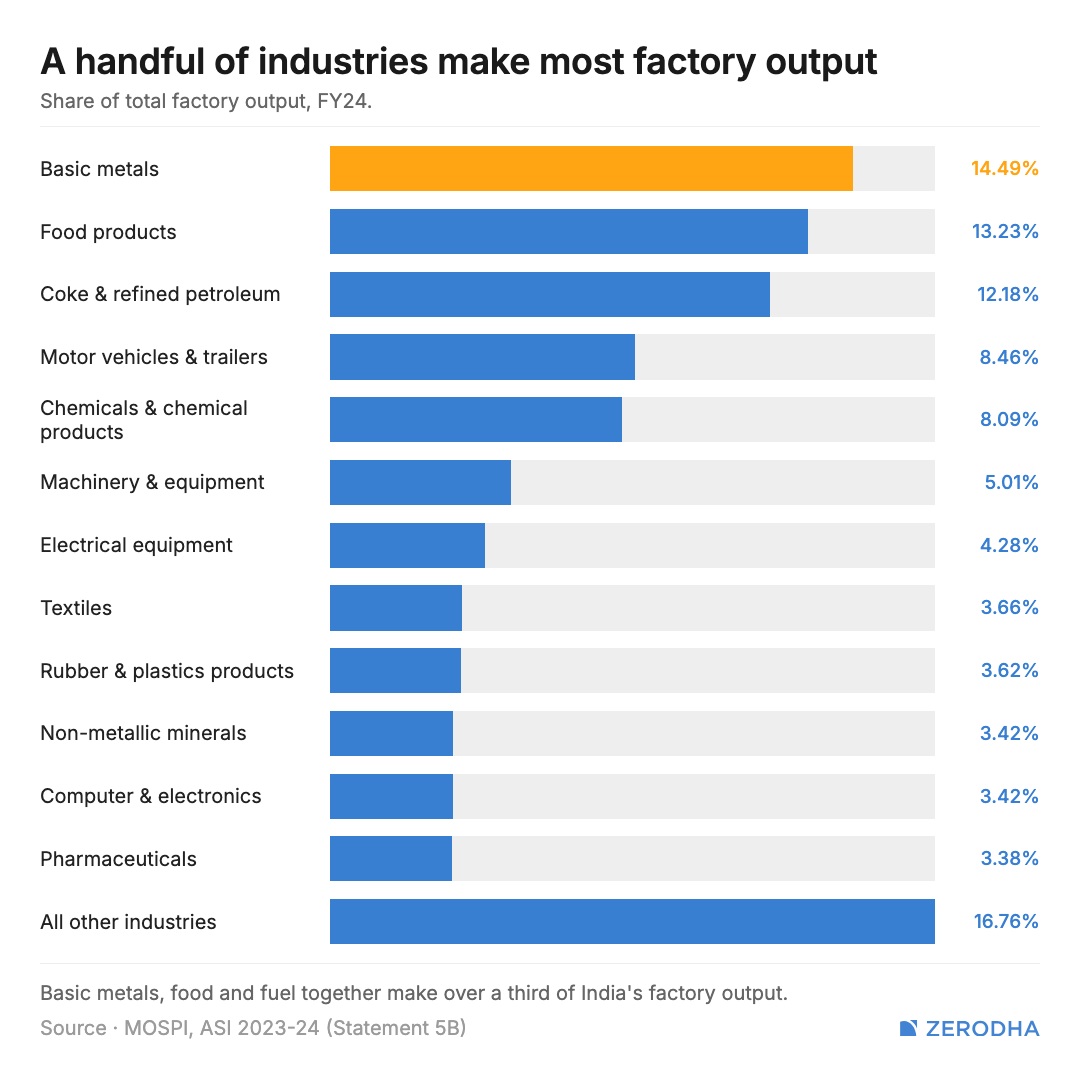
This does not mean India physically produced more metal than food. Output here is measured in rupees, not tonnes, litres or units. A rise in the price of steel or petroleum can increase the value of output even when physical production changes much less. For instance, when certain inputs get more expensive, the price of the final good can be inflated.
That is the first double edge in the data: a high output value can reflect scale and production, but it can also reflect high input prices. We need employment and value added to understand what is happening inside the factory.
Factories added jobs, but what kind?
The ASI estimated that factories engaged 1.96 crore people in 2023–24, an increase of 5.9% from the previous year. Over the decade from 2014–15, the official series shows an increase of about 57 lakh persons engaged.
These figures should not be read as India’s entire manufacturing workforce. They cover employment within the ASI factory universe, which is formal. And long-term changes can reflect the opening and closing of factories as well as updates to the survey frame. Still, they show that employment in registered factories has expanded.
Within the 1.96 crore total, around 1.55 crore people were classified as workers. In ASI language, workers are people directly or indirectly involved in the manufacturing process. “Total persons engaged” is broader: not only does it refer to assembly line workers, but it also includes supervisory and managerial staff, other employees, and unpaid family members or working proprietors.
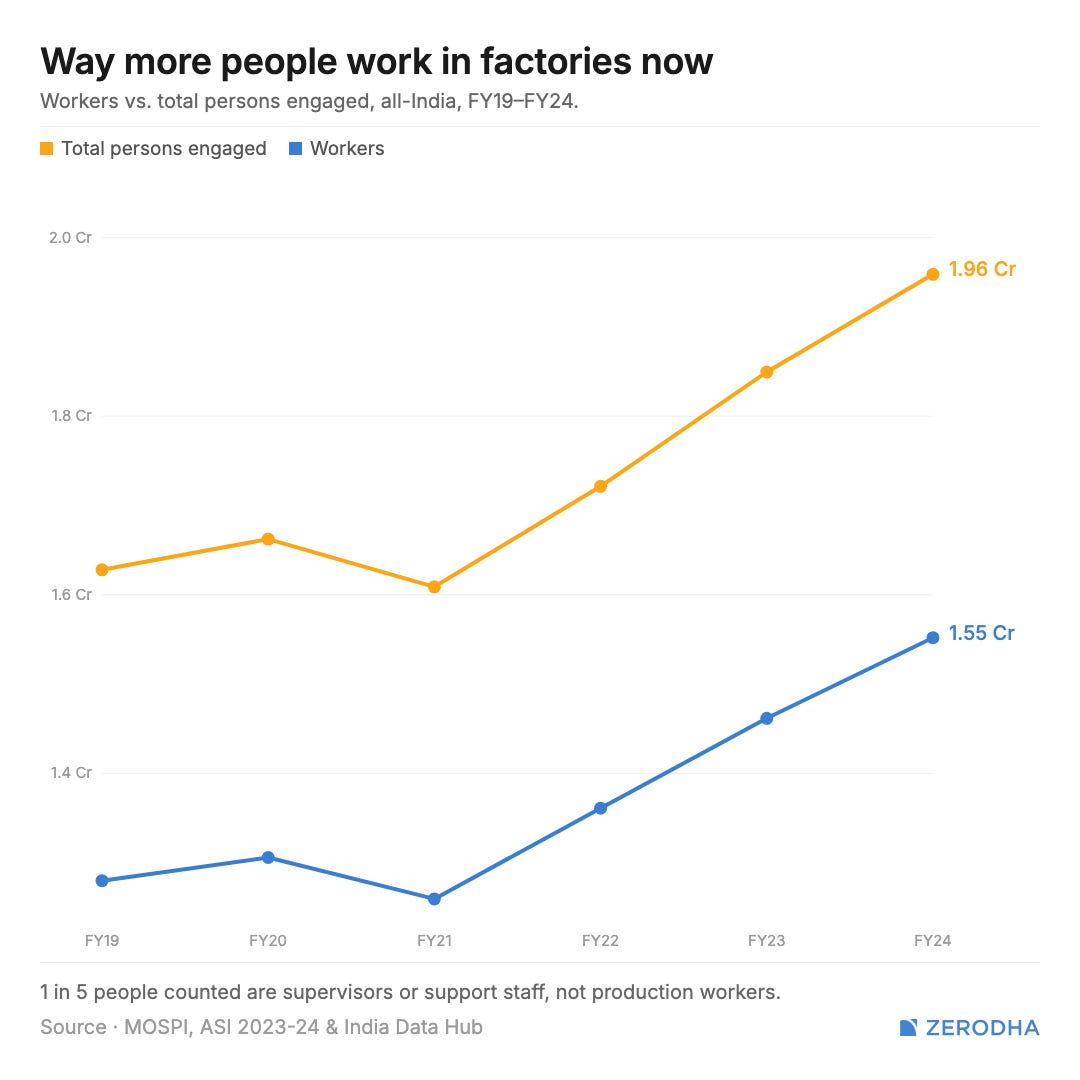
The average operating factory engaged about 92 people in 2023–24. But this average can be misleading. A small number of very large plants pull it upward, while most factories are much smaller. The median factory is therefore likely to employ fewer people than the average suggests.
It is also tempting to say manufacturing creates jobs that require no formal qualifications. That is too broad. Some factory-floor roles can absorb workers without university degrees, which is one reason manufacturing matters for a developing economy. But modern factories also need specialised technicians, machine operators, engineers and managers. The sector creates a range of jobs rather than one uniform kind of work.
The contract-worker question
The ASI separates people hired directly by a factory from workers employed through contractors. As a share of everyone engaged by factories, contract workers increased from about 16% in 2001 to 32% in 2023. Over the same period, the share of directly employed production workers declined to about 47%, while managers and other employees made up the remainder.
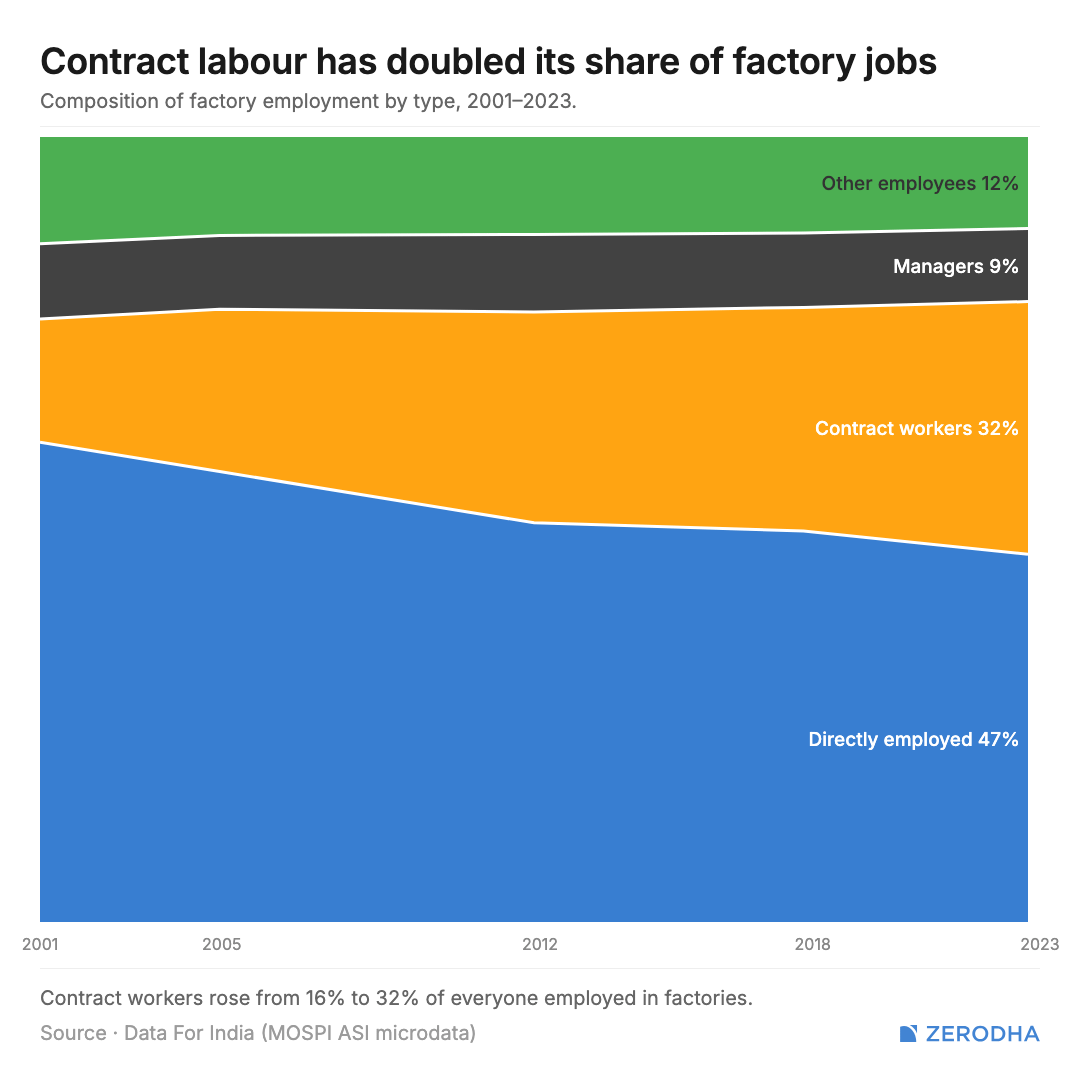
There is another valid way to calculate the contract share. If we exclude managers and other employees and compare contract workers only with all production workers, contract labour accounted for about 42% in 2023–24. The two percentages use different denominators: 32% of everyone engaged, versus 42% of workers.
Why do factories use so much contract labour?
One of the reasons is flexibility. Production can rise and fall with orders, seasons and demand. Contractors allow factories to adjust staffing without expanding permanent payroll at the same pace. They may also provide specialised workers or manage recruitment and compliance for large plants.
For businesses, that flexibility can reduce costs and make production easier to scale. For workers, the same arrangement may mean fewer direct ties to the factory and potentially weaker job security or benefits. That is the double-edged question: does contract labour help factories expand employment, or does it transfer more risk to workers?
The ASI cannot answer that on its own. It tells us how workers are engaged and what factories pay in aggregate, but it does not provide enough information on tenure, benefits, safety, job security or working conditions to judge the quality of these jobs. Nor should every contract job automatically be treated as inferior; the category can include different skills and arrangements.
What the data does establish is that contract labour is not marginal. A large part of registered factory production depends on workers who are not directly employed by the factories where they work.
The industries that produce the most are not always the ones that employ the most
At a detailed industry level, garments and clothing were the largest employers in 2023–24, engaging about 7.62 lakh people. Motor-vehicle parts employed roughly 7.54 lakh, followed by allopathic pharmaceuticals at 5.09 lakh. Cotton spinning, hot- and cold-rolled steel, bidi manufacturing and rice milling were also among the ten largest employers.
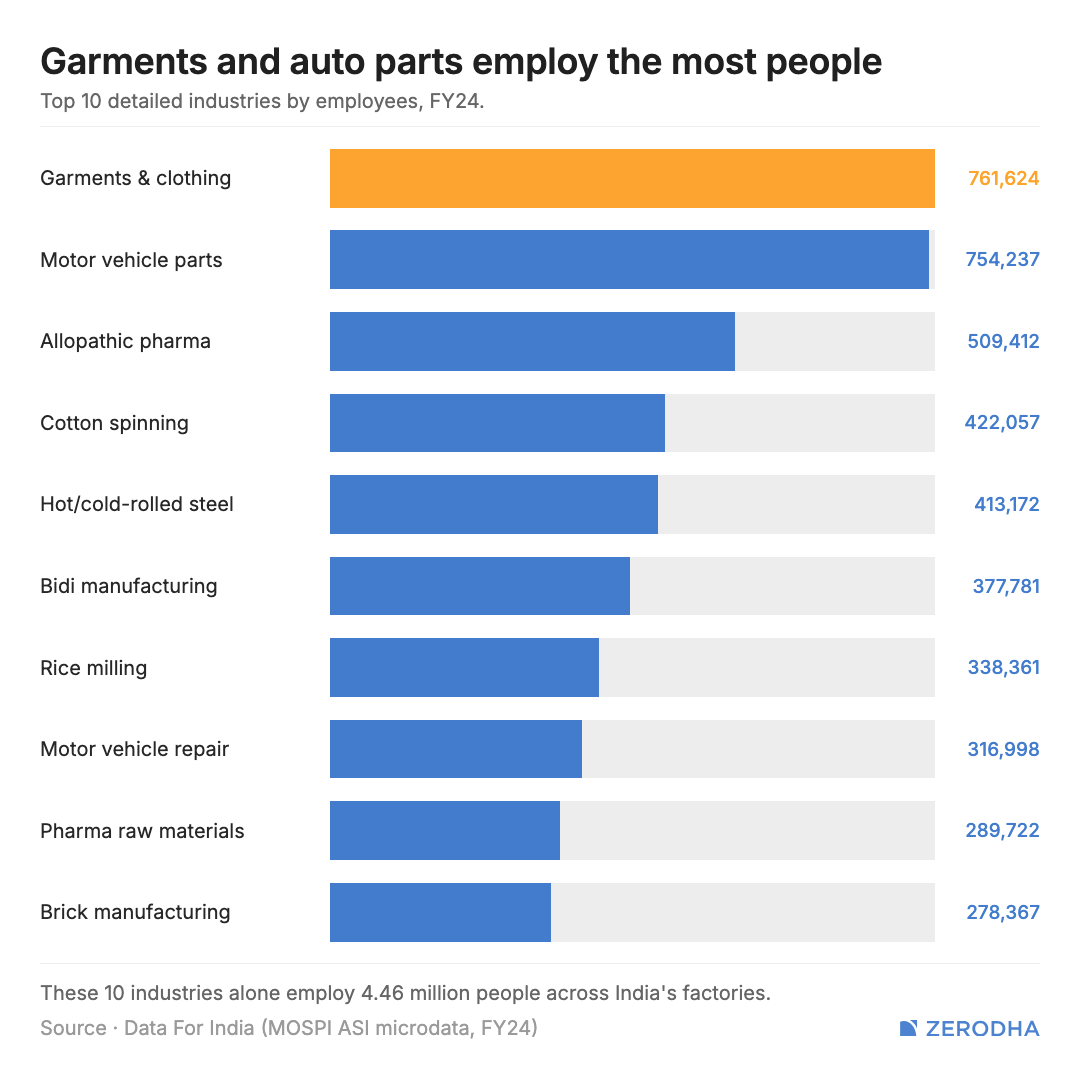
Compare this with the output chart. Refined petroleum was one of the largest industries by output, but it was nowhere near as important for employment. Garments and auto parts, instead, become far more prominent when we look at the jobs metric.
See, different industries use labour and machinery in very different proportions. A refinery can process enormous value using costly equipment and relatively few people. A garment factory needs far more workers to produce a similar rupee value of output. Even within a broad division such as motor vehicles or pharmaceuticals, it is particular activities, like components or allopathic medicines, that absorb large workforces.
So there is no single answer to which manufacturing industry is most important. Some industries matter because of how much they produce. Others matter because of how many workers they absorb. The policy trade-off is equally important: should India prioritise labour-intensive industries that can create more jobs now, or capital-intensive industries that may build scale, technology and higher value added? A strong industrial base probably needs both.
Some industries need far more capital per worker
On that note, how do factories employ “capital”?
The ASI valued fixed capital in the factory sector at about ₹46.2 lakh crore in 2023–24. Fixed capital includes productive assets such as land, buildings, plant and machinery, transport and computer equipment. Spread across everyone engaged by factories, that works out to an all-industry average of roughly ₹23.6 lakh per person.
But the average hides enormous differences. Coke and refined petroleum had about ₹365.5 lakh of fixed capital per person — more than 15 times the all-industry average. Basic metals stood at roughly ₹52 lakh, while chemicals were around ₹40 lakh. At the other end, wearing apparel had only about ₹3.8 lakh of fixed capital per person.
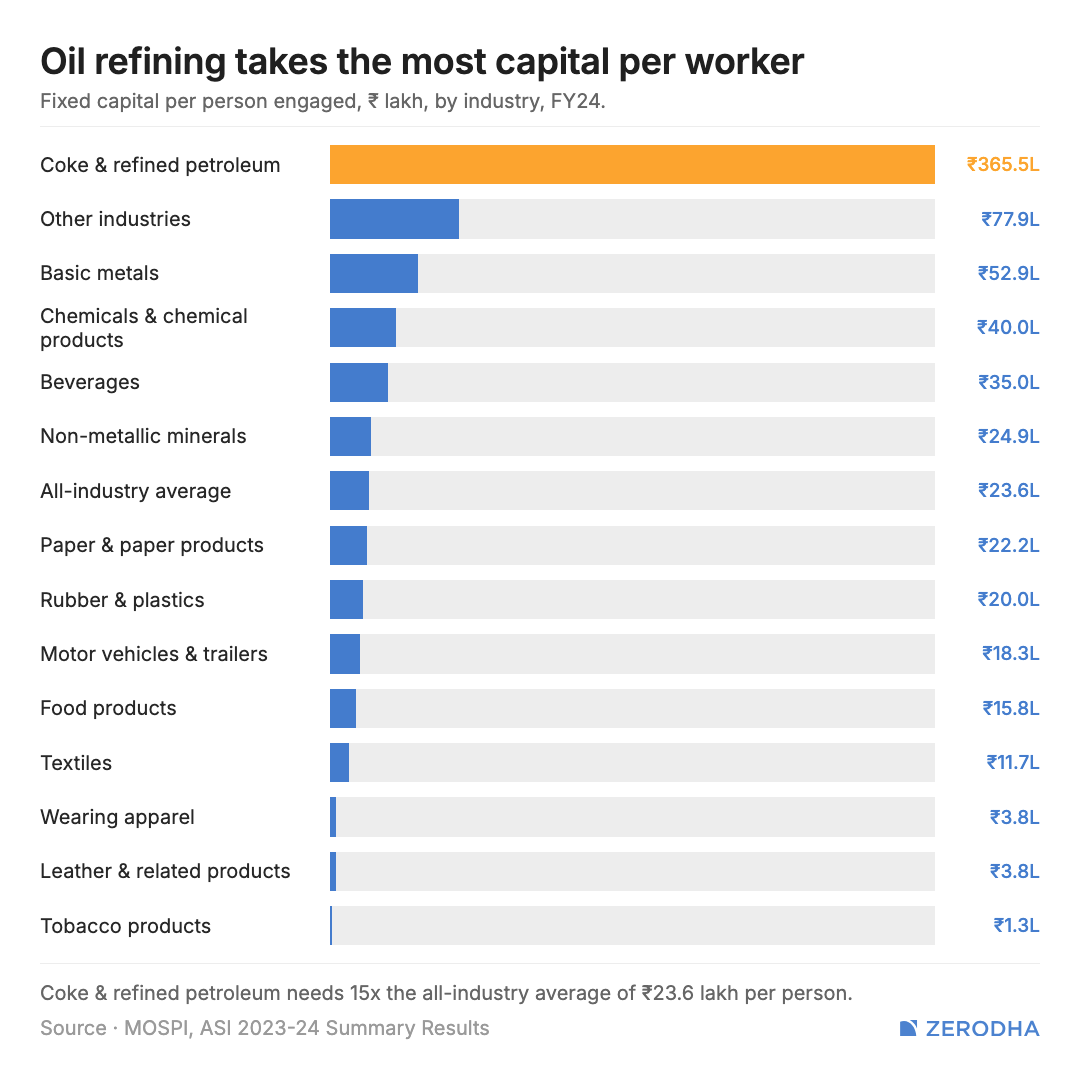
This helps explain the earlier gap between output and employment. Oil refining can generate huge output with costly plants and relatively few workers. Garment factories rely much more heavily on labour.
The measure still needs care. Fixed capital is the book value of assets already in place; it is not fresh investment during the year. A high figure can reflect expensive machinery, land and large plants, while a low figure can reflect a labour-intensive production process. It does not, by itself, tell us which industry is performing better.
Machines can help workers produce more, improve quality and reduce dangerous manual tasks. At the same time, capital-intensive industries may create fewer jobs for every rupee of assets. The relevant question is not whether India should choose machines or workers, but whether different industries are using their capital effectively.
Is factory capital creating more value?
One way to approach that question is to compare the Gross Value Added (GVA) factories generate with their fixed capital. In FY2020, factories generated about ₹0.41 of GVA for every rupee of fixed capital. The ratio improved to ₹0.55 in FY2022, before settling at ₹0.53 in FY2023 and FY2024.
This helps explain the earlier gap between output and employment. Oil refining can generate huge output with costly plants and relatively few workers. Garment factories rely much more heavily on labour.
The measure still needs care. Fixed capital is the book value of assets already in place; it is not fresh investment during the year. A high figure can reflect expensive machinery, land and large plants, while a low figure can reflect a labour-intensive production process. It does not, by itself, tell us which industry is performing better.
Machines can help workers produce more, improve quality and reduce dangerous manual tasks. At the same time, capital-intensive industries may create fewer jobs for every rupee of assets. The relevant question is not whether India should choose machines or workers, but whether different industries are using their capital effectively.
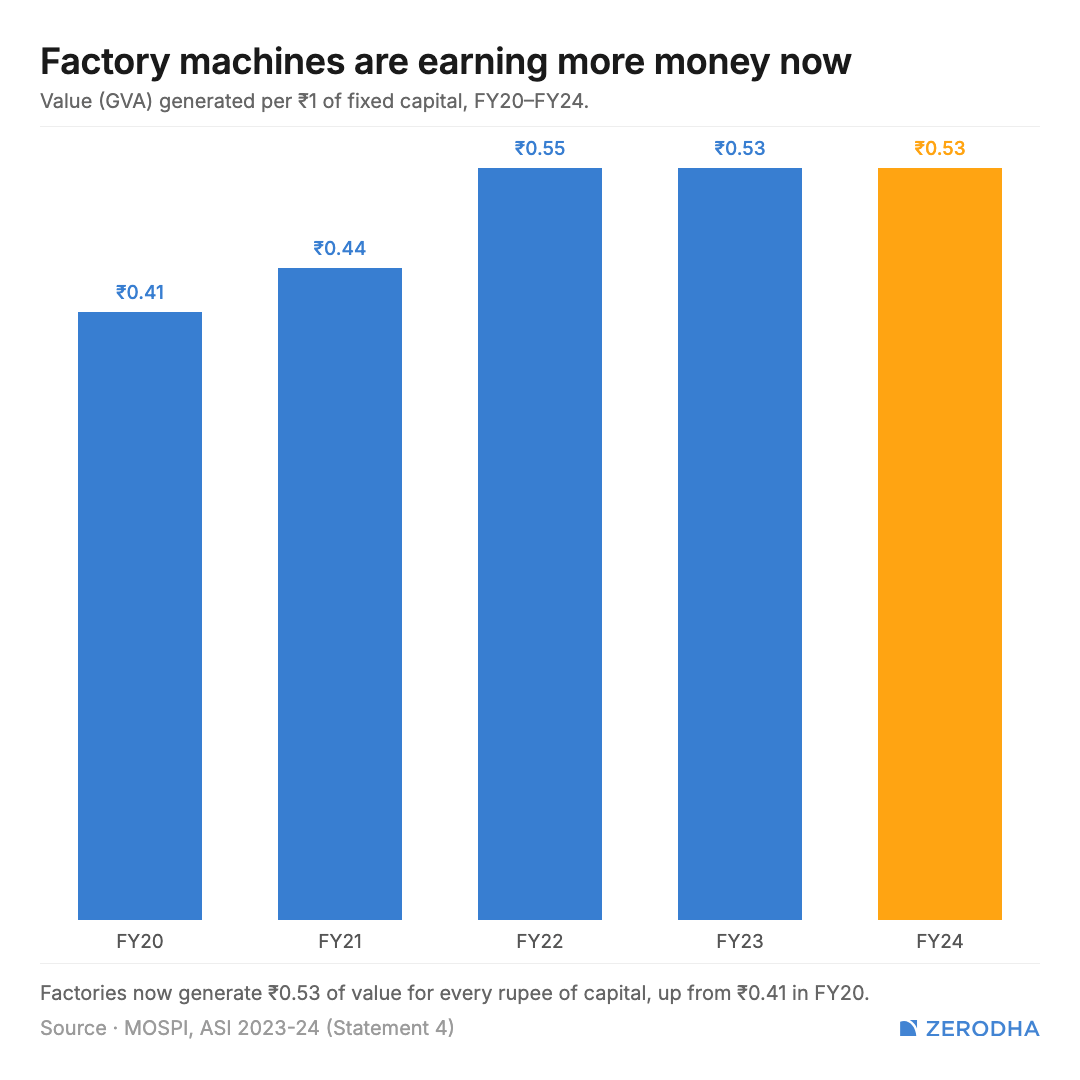
The broad improvement since FY2020 suggests that each rupee of factory capital is associated with more value added than it was at the beginning of the period. But this is not the same as calculating the return on a new machine or plant.
Fixed capital is a stock measured at book value, while GVA is a flow produced during the year. The ratio is also influenced by capacity utilisation, input prices, product prices and industry mix. The jump in FY2022 partly reflects the recovery from the pandemic-affected base of FY2021, when factories faced shutdowns and disrupted demand.
The careful conclusion is that capital productivity recovered after FY2020 and has remained around ₹0.53 of GVA per rupee of fixed capital for the last two reported years. To understand why, we need to look more closely at GVA itself.
Why did GVA grow twice as fast as output?
Suppose a factory produces goods worth ₹100. To make them, it buys ₹70 worth of raw materials, components, fuel, electricity and services from elsewhere. The factory has therefore created ₹30 of new value.
In simplified form:
GVA = Output − Intermediate inputs
Output can be enormous simply because a factory processes expensive raw materials. GVA removes the value of those purchased inputs and shows how much value the factory itself added through labour and capital.
In 2023–24, factory output was about ₹153.3 lakh crore, while GVA was about ₹24.6 lakh crore. Output per person engaged was ₹78.2 lakh, but GVA per person was only ₹12.6 lakh. The large gap represents the value of materials, fuel, components and services used in production.
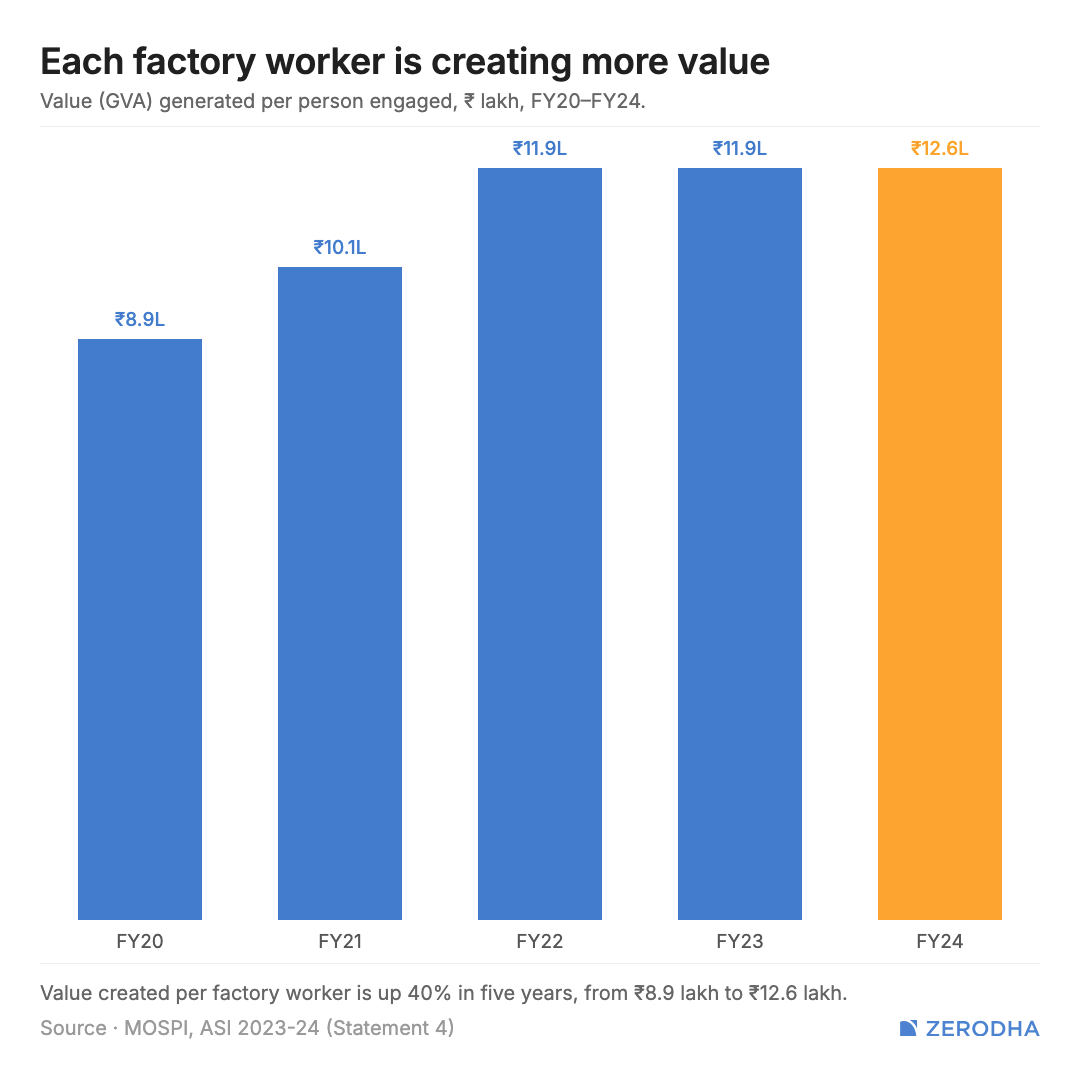
Output per person was almost unchanged from the previous year: it moved from ₹78.3 lakh to ₹78.2 lakh. GVA per person rose from ₹11.9 lakh to ₹12.6 lakh, or about 5.6% in nominal terms.
It would be tempting to call this a clear jump in worker productivity. That goes too far. GVA per person is a useful proxy for labour productivity, but it is not a physical measure of what each worker produced. It is affected by prices, profit margins, input costs, capital intensity and industry mix. A fall in the price of raw materials, for instance, can lift GVA even if the number of goods produced barely changes.
What can we say safely? Because output rose by 5.8% while GVA rose by 11.9%, intermediate inputs grew more slowly than output. The GVA-to-output ratio consequently improved from roughly 15.1% to 16%. That may reflect better margins, easing input costs, a shift towards higher-value industries, greater operating efficiency or some combination of these. The aggregate ASI data cannot isolate how much each factor contributed.
This is the second major double edge in the story: creating more value from the same gross output can signal greater efficiency, but in nominal data it can also reflect movements in prices and margins.
A lot of small factories, but most value comes from large ones
Most of this addition to GVA comes from larger rather small factories.
Factories employing 100 people or fewer accounted for about 78% of factories, but only 22% of the workforce, 14% of fixed capital and 12% of value added. Factories with more than 100 employees represented only 22% of factories, yet accounted for 79% of the workforce and 88% of value added.
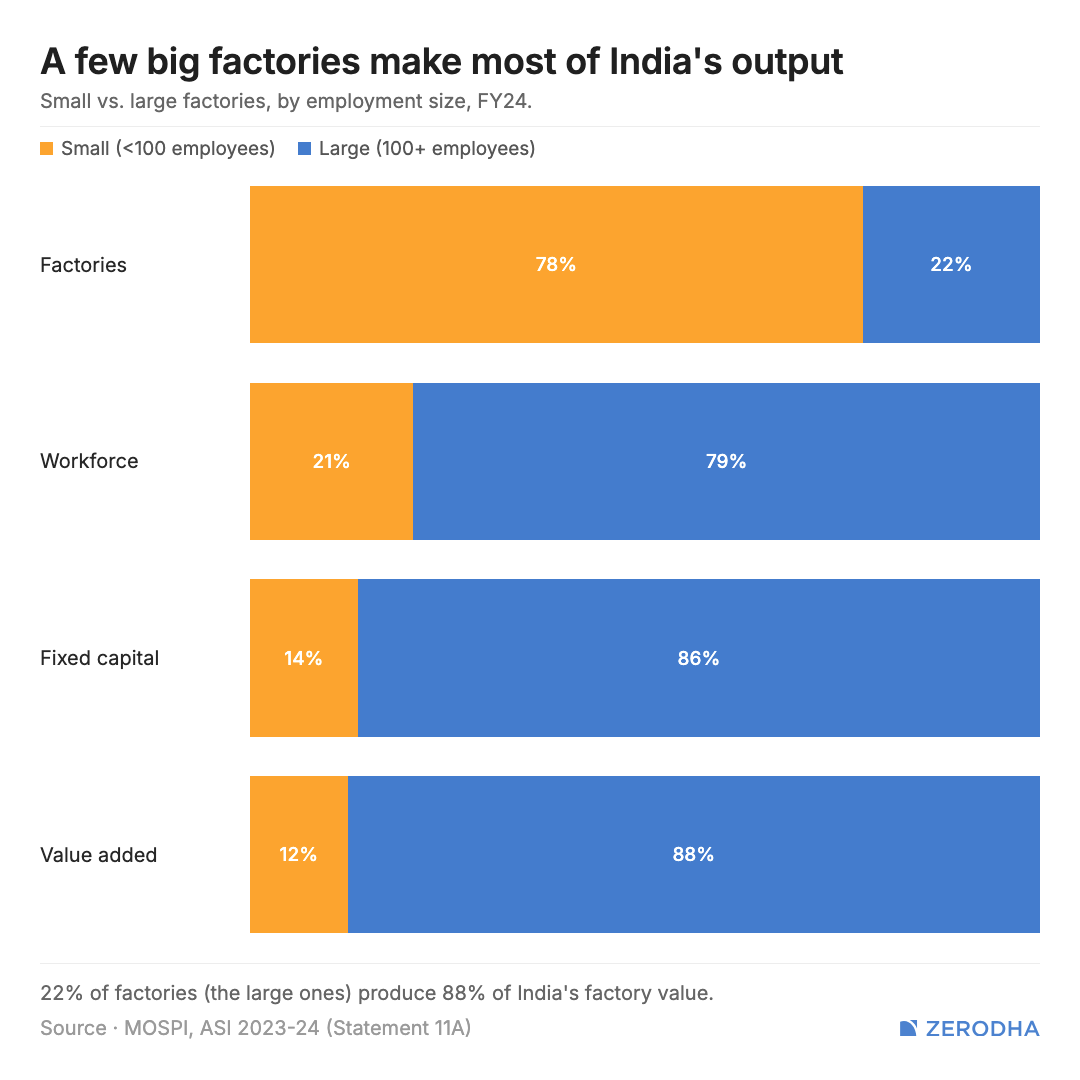
Why is the gap so large? Big plants combine more workers with much more machinery, larger production runs, specialised processes and extensive supplier networks. Scale can allow each factory to generate far more output and value than a small unit.
But concentration is again double-edged. Large factories can bring scale, productivity, exports and formal employment. Smaller factories can spread entrepreneurship and jobs across more places and may serve as suppliers to larger companies. If small firms remain permanently small because they lack finance, technology, infrastructure or market access, the economy misses an opportunity. If they grow into capable suppliers, the apparent divide between small and large factories can become an industrial network instead.
The right question is therefore not simply whether large factories are better. It is whether India has enough pathways for small factories to become more productive, connect to larger supply chains and scale when they are ready.
Where are the jobs, and where is the value?
Comparing each industry’s share of employment with its share of GVA brings the story together. Food products accounted for 11.1% of factory employment but only 7.4% of GVA. Textiles and wearing apparel also contributed much larger shares of employment than value added. These are relatively labour-intensive industries. Basic metals show the reverse: they accounted for 7.8% of employment but 11.6% of GVA.
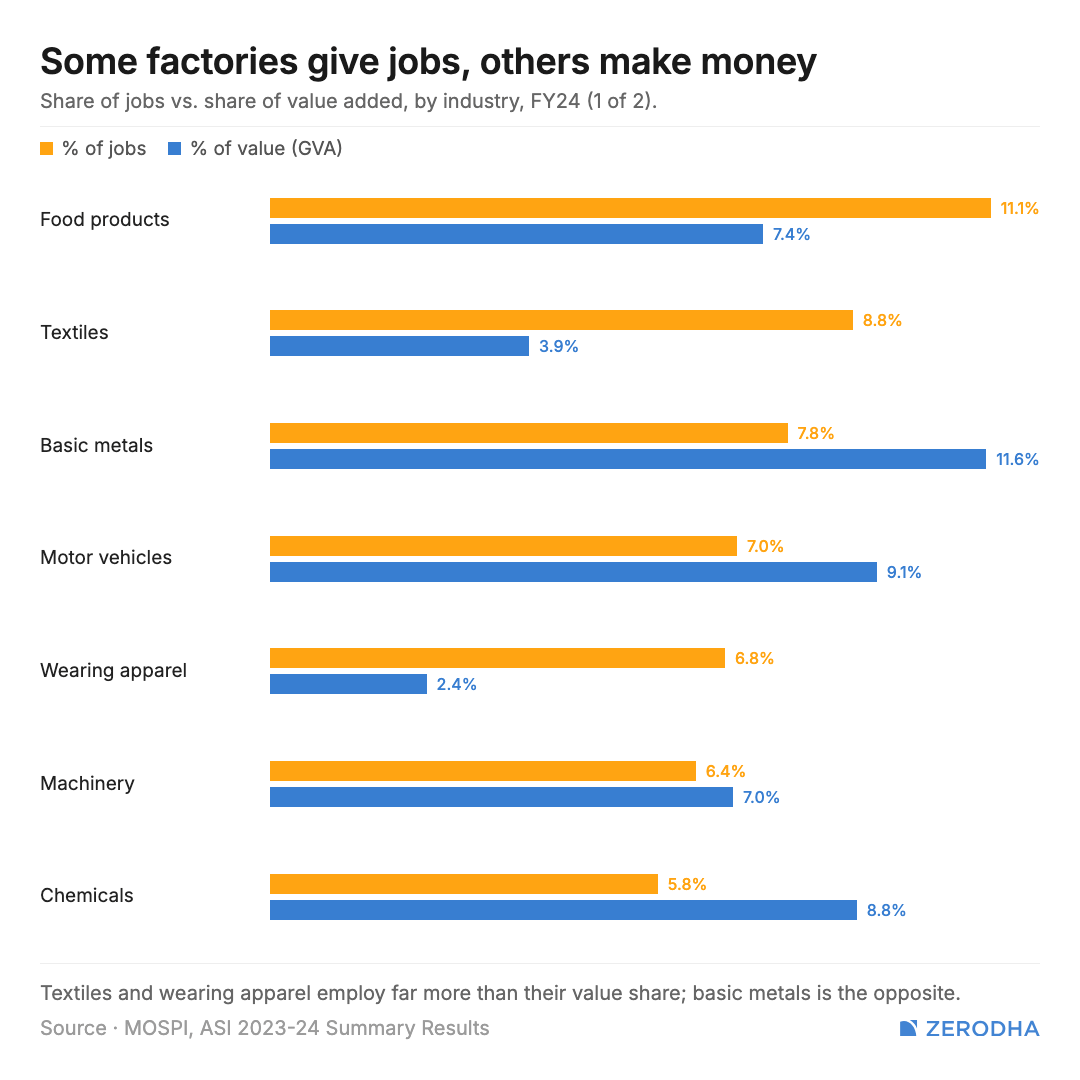
Pharmaceuticals produced 7.2% of GVA with 4.9% of employment, while coke and petroleum generated 6.2% of GVA with only 0.9% of jobs. These are more capital-heavy or higher-value activities.
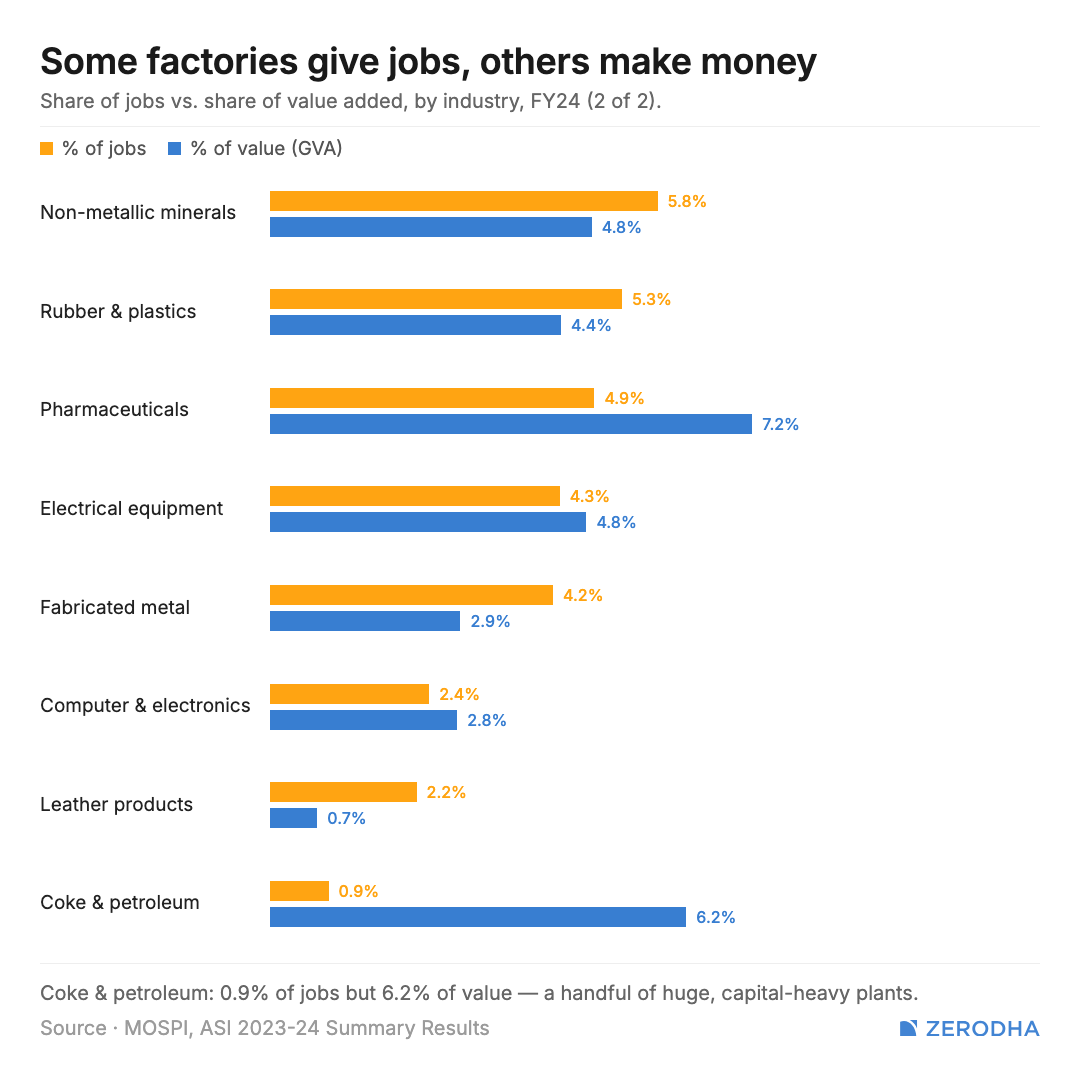
Different industries combine workers, machinery, intellectual property and expensive inputs in very different ways. A high GVA share relative to employment can indicate valuable products or capital-intensive production, but it does not make a labour-intensive industry unproductive or unimportant. Labour-intensive industries may be doing a different economic job: absorbing workers and spreading income more widely.
The most useful way to read this chart is not as a ranking from “good” to “bad”, but as a map of different roles within manufacturing. Some industries are employment engines. Some are value engines. A few manage to be important on both measures.
So, what kind of factory economy is India building?
The 2023–24 ASI presents a factory sector that is expanding employment, becoming more capital-heavy and creating a larger amount of value relative to its gross output. But each positive headline comes with a second question.
Employment increased, but so did the engagement of contract workers, who now account for nearly a third of everyone engaged, or 42% when measured only against production workers.
Capital intensity varies enormously, as oil refining uses more than 15 times the capital per person of the all-industry average.
GVA grew almost twice as fast as output—but prices, margins and input costs can all influence that gap.
Large factories created most of the value, but a healthy industrial system also needs smaller suppliers that can become more productive and scale.
None of this makes the expansion meaningless. It simply changes what we should ask of the data. The goal is not to maximise a single number such as factories, output, jobs or capital. A deeper industrial base needs to combine several things: enough labour-intensive production to absorb workers, enough capital and technology to remain competitive, rising real wages, stronger domestic supply chains and routes for smaller firms to grow.
The ASI gives us one of the clearest views of that process inside registered factories. It shows that India’s factory system is larger and more valuable than it was a decade ago. It also shows why the next stage of the manufacturing story cannot be judged by output alone.
That’s it for the eighth edition.
We hope you enjoyed what we’ve put together for you. This is a new format for us, and we fully understand that there are rough edges and plenty of things that can be improved.
And that’s where your end of the bargain begins.
Please send us your feedback, ideas, suggestions, criticisms, and anything else you think can help make this publication better. Unlike many people who say this as a ritual and then promptly ignore what follows, we genuinely do read the comments, emails, and messages we receive.
Points & Figures is still a work in progress, and we’d love your help in shaping what it becomes.
So let us know what you liked, what you didn’t, what you’d like to see more of, and what you’d like us to do differently. We’ll read it all and use it to make future editions more useful, more insightful, and hopefully a lot more fun.
Until next time.
A request I think to summarise the entire article point wise will make for much better reading